Gerrit Poldera and Aoife Gowenb
aWageningen University & Research, Wageningen, Netherlands
bSpectral Imaging Research Group, School of Biosystems and Food Engineering, University College Dublin, Ireland
DOI: https://doi.org/10.1255/sew.2021.a12
© 2021 The Authors
Published under a Creative Commons BY licence
Hyperspectral imaging is currently a very well-known and much used technology for measuring features in different fields, such as chemistry, geology, medicine, food and agriculture, either spaceborne (satellites), airborne (drones) or at close proximity (e.g. field scanning, industrial sorting lines or microscopy). Its background is two-fold, and it can be considered as a special case of spectroscopy (“imaging spectroscopy”) or a special case of imaging (“spectral imaging”). Current practice is to use adjectives such as multi and hyper added to “spectral imaging” in order to characterise the number of wavelength bands. In this paper we propose the community to use scientifically sound terminology, like “imaging spectroscopy” or “spectral imaging”, without using ambiguous adjectives. Further, we encourage the community to define and agree upon clear adjectives to describe the number of variables in the naming of our imaging technique.
Historical notes
Spectroscopy has its origin in the 17th century when Isaac Newton demonstrated that white light from the sun could be dispersed into a continuous series of colours, coining the word spectrum to describe this phenomenon. Later, Kirschoff and Bunsen1 found a relationship between the chemicals and the specific spectrum of light emitted when gases are burned. Traditionally, single (“point”) spectra are measured within a single spatial region, however, this technique has been extended to scanning multiple spectra in a spatial preserving way, resulting in imaging spectroscopy. Conversely, spectral imaging finds its background in imaging. The first photographs only depicted different values of grey, where a pixel’s grey value denotes the light reflection over the whole visible spectrum. In colour imaging, each pixel consists of a red, green and blue pixel, similar to the light receptors in a human eye. By extending the number of wavebands per pixel the technique of spectral imaging was born.
The term “hyperspectral imaging” originated in the mid-1980s from the remote sensing community with the development of the Airborne Imaging Spectrometer (AIS) at NASA’s Jet Propulsion Lab, an airborne instrument capable of imaging large regions of the Earth in the short-wavelength infrared (SWIR) wavelength range (1200–2400 nm).2,3 The subsequent development of NASA’s Airborne Visible/Infrared Imaging Spectrometer (AVIRIS) expanded the application of spectral imaging to a wide range of tasks, from vegetation monitoring to mineral mapping on the Earth’s surface. The term “imaging spectroscopy” is now preferred over “hyperspectral imaging” by NASA.4 However, use of the term “hyperspectral imaging” has persisted and grown in both the scientific and non-scientific vernacular. Indeed, a recent paper title search in Web of Science indicates that in excess of three times more articles have been published in the past 10 years with the words “hyperspectral imaging” in the title than with “imaging spectroscopy”. Figure 1 depicts the number of hits for both terms as function of time. From this graph we clearly see that although “imaging spectroscopy” is used much earlier than “hyperspectral imaging”, the latter increased exponentially and overtook “imaging spectroscopy” in 2005.
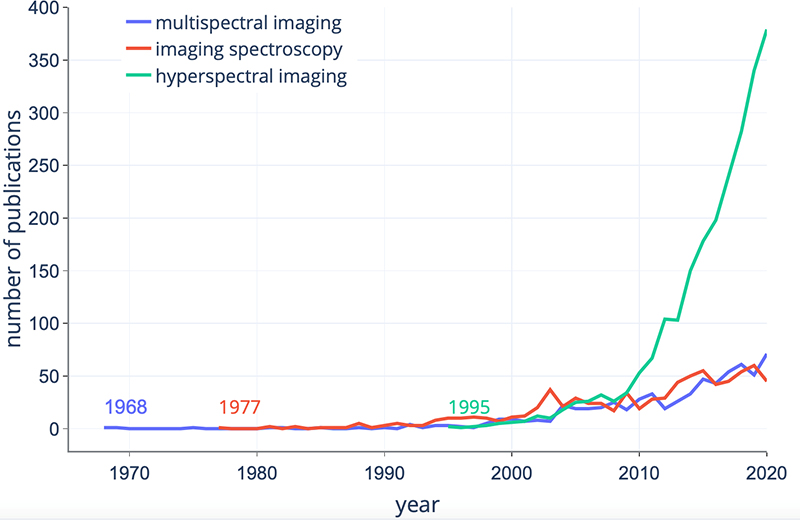
Figure 1. Web of Science title search hits for “hyperspectral imaging”, “multispectral imaging” and “imaging spectroscopy”. Updated from Reference 14.
Discussion
Currently, it is common practice to subdivide spectral imaging into multispectral imaging for images with a few waveband values and hyperspectral imaging for images composed of hundreds of waveband values. In our opinion this subdivision is prone to subjectivisms, which is proven by the fact that some papers use “multispectral” for images with 25 wavebands5 while others use “hyperspectral” for the same number of wavebands.6 In the literature “hyperspectral” mainly is related to imaging, but there are a few examples where “hyperspectral analysis” refers to plain spectroscopy,7 adding further ambiguity to the term. To make it even more confusing sometimes “superspectral” is used for 10–20 bands.8,9 The question also arises: what’s beyond hundreds of wavebands? In literature, the term “ultraspectral” is used for images with 512 wavebands10 while others use it for images with more than 2000 bands.11
Although with regard to the processing of data envisaged in publications, indicating the number of spectral variables in the name of the imaging technique has its advantages. For example: the complexity of the algorithms and the suitability of different analysis approaches (e.g. chemometrics, image analysis or hybrid approaches) may differ according to the number of wavebands. Nevertheless, the use of ambiguous terms, as mentioned above, does not contribute to the clarity of the research publications.
A side effect of using the term hyperspectral imaging is that often the term hypercube is used as a reference to hyperspectral image data. From a Web of Science search over the period 2015–2019, we found 38 articles having “hyperspectral” in the title that mentioned the term “hypercube” in the title, abstract or keywords. A typical example is the development of convolutional sparse coding techniques for hyperspectral images.12
In geometry, a hypercube is an n-dimensional analogue of a square (n = 2) and a cube (n = 3).13 Spectral image data in general is a three-dimensional array with spatial information in the first two dimensions and spectral information in the third dimension (Figure 2). It is seldom a cube, as the spatial and spectral dimensions most often differ from each other. Therefore, hypercube is not a proper term to describe spectral image data.
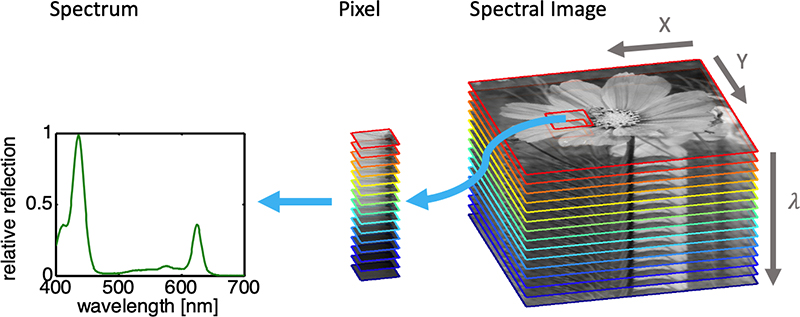
Figure 2. A spectral image depicted as three-dimensional data array.
Conclusion
To conclude, we propose that the community promote the use of scientifically sound terminology, such as “imaging spectroscopy” or “spectral imaging”, without using exaggerated adjectives. Furthermore, we advise against the use of inappropriate terms, like hypercube for a three-dimensional (x,y,λ) data array or hyperspectral analysis for point spectroscopy.
References
- G. Kirchhoff and R. Bunsen, “Chemical analysis by observation of spectra”, Ann. Phys. Chem. Poggendorff 110, 161–189 (1860). https://doi.org/10.1002/andp.18601860602
- W.C. Chiou, “NASA image-based geological expert system-development project for hyperspectral image-analysis”, Appl. Opt. 24(14), 2085–2091 (1985). https://doi.org/10.1364/AO.24.002085
- A.F.H. Goetz, G. Vane, J.E. Solomon and B.N. Rock, “Imaging spectrometry for Earth remote-sensing”, Science 228(4704), 1147–1153 (1985). https://doi.org/10.1126/science.228.4704.1147
- NASA, AVIRIS Airborne Visible/Infrared Imaging Spectrometer. Retrieved from https://aviris.jpl.nasa.gov
- W. Zhang, Q. Zhu, M. Huang, Y. Guo and J. Qin, “Detection and classification of potato defects using multispectral imaging system based on single shot method”, Food Anal. Meth. 12(12), 2920–2929 (2019). https://doi.org/10.1007/s12161-019-01654-w
- J. Gao, D. Nuyttens, P. Lootens, Y. He and J.G. Pieters, “Recognising weeds in a maize crop using a random forest machine-learning algorithm and near-infrared snapshot mosaic hyperspectral imagery”, Biosyst. Eng. 170, 39–50 (2018). https://doi.org/10.1016/j.biosystemseng.2018.03.006
- B. Ling, D.G. Goodin, E.J. Raynor and A. Joern, “Hyperspectral analysis of leaf pigments and nutritional elements in tallgrass prairie vegetation”, Front. Plant Sci. 10, 142 (2019). https://doi.org/10.3389/fpls.2019.00142
- A.M. Collin, M. Andel, D. James and J. Claudet, “The superspectral/hyperspatial worldview-3 as the link between spaceborne hyperspectral and airborne hyperspatial sensors: The case study of the complex tropical coast”, Int. Arch. Photogramm. Remote Sens. Spatial Inf. Sci. XLII-2/W13, 1849–1854 (2019). https://doi.org/10.5194/isprs-archives-XLII-2-W13-1849-2019
- I. Herrmann, E. Bdolach, Y. Montekyo, S. Rachmilevitch, P.A. Townsend and A. Karnieli, “Assessment of maize yield and phenology by drone-mounted superspectral camera”, Precision Agric. 21(1), 51–76 (2020). https://doi.org/10.1007/s11119-019-09659-5
- A.D. Meigs, L.J.I. Otten and T.Y. Cherezova, “Ultraspectral imaging: a new contribution to global virtual presence”, IEEE Aerospace Electron. Syst. Mag. 23(10), 11–17 (2008). https://doi.org/10.1109/MAES.2008.4665319
- R. Herrero and V.K. Ingle, “Backward and forward linear prediction applied to ultraspectral image processing”, Signal Image Video Process. 10(4), 639–646 (2016). https://doi.org/10.1007/s11760-015-0788-y
- P.V. Arun, B. Krishna Mohan and A. Porwat, “Spatial-spectral feature based approach towards convolutional sparse coding of hyperspectral images”, Comput. Vis. Image Understand. 188, 102797 (2019). https://doi.org/10.1016/j.cviu.2019.102797
- Wikipedia, Hypercube. Retrieved from https://en.wikipedia.org/wiki/Hypercube
- G. Polder and A. Gowen, “The hype in spectral imaging”, J. Spectral Imaging 9, a4 (2020). https://doi.org/10.1255/jsi.2020.a4

Gerrit Polder
Gerrit Polder is senior researcher Image Analysis and Machine Vision at the department Greenhouse Technology of Wageningen University and Research Center. he has a Ph.D. from Delft University of Technology on spectral imaging for measuring biochemicals in plant material. With protected cultivation and arable farming as main application fields, his research interests include imaging spectroscopy and spectral imaging for disease detection and high throughput automated plant phenotyping. He is (co-)author of 3 book chapters and more than 80 papers in peer reviewed journals and conference proceedings. 0000-0003-4896-4776
[email protected]

Aoife Gowen
Aoife Gowen is a Professor in the School of Biosystems and Food Engineering at University College Dublin in Ireland. Her research area is multidisciplinary, involving applications of Spectral Imaging and chemometrics to biological systems, including foods, microbes and biomaterials. She is editor in chief of the Journal of Spectral Imaging and has developed new research-informed modules in spectral imaging and sensors for undergraduate and graduate students. 0000-0002-9494-2204
[email protected]


