
Marco Bortoluzzi* and Valentina Ferraro
Dipartimento di Scienze Molecolari e Nanosistemi, Università Ca’ Foscari Venezia, Via Torino 155, 30172 Mestre (VE), Italy
Contacts
[email protected] ( 0000-0002-4259-1027)
[email protected] ( 0000-0003-2694-2955)
Introduction
Radioactivity is inescapably present in everyday life.1 Radiochemistry is a topic of significant interest, strongly connected with energy production, medicine and environmental protection. Experiences concerning gamma spectroscopy in Inorganic and Physical Chemistry undergraduate laboratories are, however, hardly widespread, because of obvious problems related to students’ safety and the storage of radioactive sources.2 Basic knowledge about radioactive decays is usually offered by General and Inorganic Chemistry courses, but the information is not supported by hands-on learning. Safe laboratory experiments could give insight into several aspects related to radioactivity, such as naturally occurring radioisotopes, decay modes and lifetimes, interactions of radiation with matter and detection techniques. The idea of carrying out undergraduate gamma spectroscopy experiments with elements commonly classified as non-radioactive strongly limits the choice of possible samples. Lanthanum is particularly interesting for such a purpose because of the naturally occurring 138La isotope.
The 138La radioactive isotope constitutes 0.0902 % of naturally occurring lanthanum. The half-life (t1/2) of this isotope is very long, 1.05 × 10¹¹ years. 138La disintegration is due to two parallel processes. 34 % of the isotope undergoes β– decay, with the conversion of a neutron into a proton, turning into the stable 138Ce. The process is associated with the emission of a 788.7 keV gamma photon (Equation 1). The remaining 66 % of 138La disintegrates by electronic capture (EC), i.e. the conversion of a proton to a neutron by interaction with an electron. The EC process leads to the formation of stable 138Ba with the emission of a 1435.8 keV gamma photon (Equation 2).3 The EC and β– processes also produce neutrinos (νe) and antineutrinos (\({\bar \nu _{\rm{e}}}\)).4
\[{}^{138}{\rm{La}}\buildrel {{\beta ^ - }} \over \longrightarrow {}^{138}{\rm{Ce}} + \gamma (788.7{\rm{ keV}}) + {\bar \nu _{\rm{e}}}{\rm{, 34}}\;{\rm{\% }}\]
(1)
\[{}^{138}{\rm{La}}\buildrel {{\rm{EC}}} \over \longrightarrow {}^{138}{\rm{Ba}} + \gamma (1435.8{\rm{ keV}}) + {\nu _{\rm{e}}}{\rm{, 66}}\,{\rm{\% }}\]
(2)
The two emissions from 138La are comparable with those of other radioactive isotopes present in the environment. For example, the gamma photon emitted by the EC decay of 40K to 40Ar has 1460.8 keV energy.5137Cs undergoes β– decay with formation of the metastable 137mBa. The subsequent decay to the nuclear ground state releases a 661.7 keV gamma photon.6 The gamma photons from 138La have higher energy if compared to those emitted by refined samples of 238U. In this case, the radioactivity is associated with the α decay of the isotope, which leads to the formation of 234Th. The latter transforms by β– decay in 234Pa and the process is associated with the emission of gamma photons having 63 keV and 92 keV energy.7 To better understand the energy scale, just consider that, according to the relationship E = mc2, the mass of an electron is equal to 511 keV.
Scintillation detectors
Gamma photons emitted by 138La can be detected by an instrument known as a scintillator or scintillation detector. A crystal of suitable material can emit a weak flash consisting of photons in the visible–ultraviolet range if hit by a gamma photon. The number of photons constituting the flash is proportional to the energy of the incident gamma photon. One of the most popular materials for scintillator crystals is thallium-activated sodium iodide, NaI(Tl).8
Gamma photons weakly interact with matter. For example, the intensity of a 1000 keV gamma photon beam is halved by a lead shield of 0.87 cm thickness.4 At a first approximation, the absorption of gamma radiation by a material decreases with increasing energy. The scintillator crystal must be relatively large to detect high-energy gamma photons such as those from 138La. The efficiency is, however, limited to few percentage points.
A photocathode coupled to the crystal emits electrons when hit by light, proportionally to the number of photons in the flash and, therefore, to the energy of the incident gamma photon. The electrons emitted by the photocathode can be amplified by a photomultiplier tube (PMT), thus obtaining a detectable electrical impulse. The amplitude of the impulse, expressed in volts, is linearly proportional to the energy of the gamma photon. The number of electrical impulses in a given time interval can be measured with a counter. With an amplifier/pulse height analyser, it is possible to select the range of pulse amplitudes (in volts) to be counted and build a gamma spectrum with the pulse amplitudes in the abscissa, while the number of counts is reported in the ordinate. The main components of a scintillation detector are depicted in Figure 1.
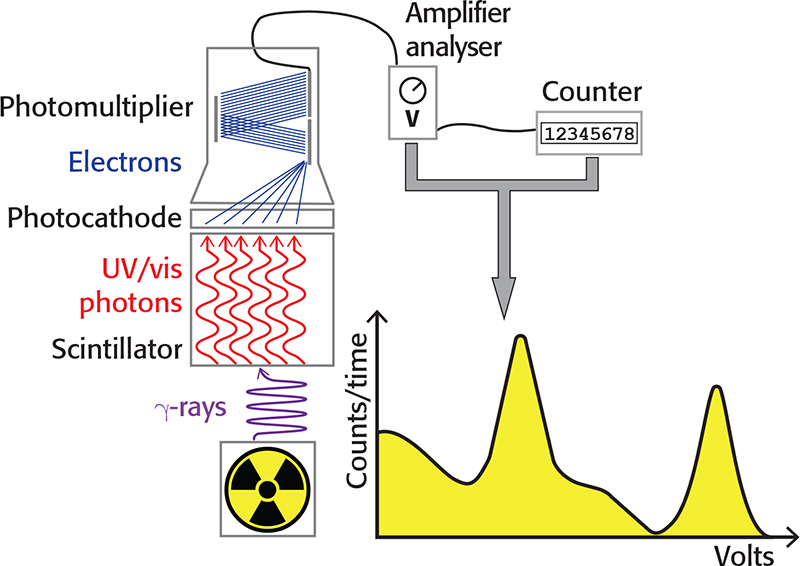
Figure 1. Schematic representation of a scintillation detector.
If the energy of the gamma photons is completely absorbed by the scintillator, the corresponding photopeak is observed in the spectrum. The energy resolution of the photopeak is defined as the ratio between the half-height width and the peak energy. The ratio decreases, i.e. the energy resolution improves, on increasing the photon energy.8
The incomplete absorption of energy by the crystal involves the presence in the spectrum of a continuum of signals with energy lower than the photopeak. Gamma photons can impact the electrons of the material by transferring part of their energy, thus obtaining a new photon with lower energy and different direction (Compton scattering).4 The photon generated after the collision can exit the crystal and, in this case, only the energy transferred to the electron will be counted. It can also happen that the gamma photon first hits the material surrounding the source (e.g. a lead shield), transferring part of its energy to it, and the new photon thus generated can interact with the scintillator. The photon energy generated by the Compton scattering, E’γ, depends on the energy of the incident photon Eγ and the angle θ between the two photons, as shown in Equation 3. In the equation, m is the mass of the electron and mc2 is 511 keV. The effects of Compton scattering are depicted in Figure 2.
\[{E'_\gamma } = {{{E_\gamma }} \over {1 + \left( {{{{E_\gamma }} \over {m{c^2}}}} \right)(1 - \cos \theta )}}\]
(3)
E’γ coincides to Eγ if the angle θ is zero, while the minimum E’γ value is for θ = 180 °. As a consequence, in the presence of Compton scattering the largest energy transfer to the scintillator occurs when the γ photon hits the scintillator and a γ’ photon exits the crystal at 180 ° with respect to the first one (Compton edge). For example, if Eγ is 1435.8 keV, E’γ is 216.9 keV and the energy measured by the detector is 1218.9 keV (1435.8 – 216.9 keV). On the other hand, if the γ photon is emitted from the source in the opposite direction with respect to the crystal, the impact with the shielding can produce a photon at 180 ° with respect to the incident one and the detector could count the 216.9 keV γ’ photon.
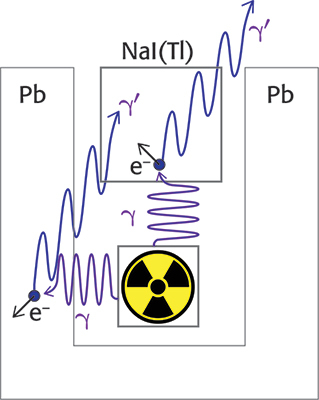
Figure 2. Effects of the Compton scattering on the signals received by the scintillation detector.
Another phenomenon that can lead to the presence in the gamma spectrum of signals at lower energies with respect to the photopeak is pair production, which must be taken into account only for gamma photons having energy greater than 1022 keV.4,8 It is worth noting that the mass of an electron (or positron) corresponds to 511 keV. Given the mass–energy equivalence, a gamma photon with energy greater than 1022 keV can interact with matter behaving like an electron–positron pair and a residual amount of energy. For example, a 1435.8 keV gamma photon corresponds to an electron–positron pair plus 413.8 keV. The positron interacts with an electron of the scintillator crystal, leading to annihilation and to the formation of two new γ’ photons having energies equal to 511 keV, propagating in opposite directions. The electron consumed by annihilation is replaced in the total balance by that deriving from the incident photon, while the residual energy can be absorbed and counted. If the two 511 keV photons are absorbed by the crystal, then all the energy of the incident photon is detected, increasing the intensity of the main photopeak. If one of the two 511 keV photons escapes from the crystal, the detector instead measures an energy equal to (Eγ – 511) keV, known as a single escape peak. If both 511 keV photons leave the crystal, the energy detected is (Eγ – 1022) keV, corresponding to the double escape peak. The intensities of the single and double escape peaks depend on the size of the crystal used. The process of pair production followed by annihilation can also involve the shielding surrounding the experimental apparatus, and one of the two 511 keV photons can be subsequently counted by the detector (annihilation peak).
Finally, it is worth noting that the electronic structure of the materials undergoes major alterations due to interaction with gamma photons. For example, it is possible to observe peaks in the 75–85 keV range associated with X-rays deriving from transitions in the innermost electronic shell of the lead atoms constituting the shield. Furthermore, if NaI(Tl) is used as a scintillator crystal and the resolution of the spectrum is sufficient, a second peak having 28 keV less energy may appear close to the main photopeak due to the escape from the crystal of the X-photon associated with an internal electronic transition of iodine.9
Lanthanum gamma spectrum
In our experiments, a cylindrical NaI(Tl) crystal with diameter and height of 7.6 cm was used, protected by an aluminium layer, with an integrated photodiode and photomultiplier. The declared efficiency is around 2 % for 500 keV photons and drops to about 1.3 % for energy values around 2000 keV. The crystal produces approximately 104 photons/MeV of absorbed energy (wavelength between 300 nm and 500 nm). The scintillator photomultiplier was connected to a preamplifier (Tennelec TC155A), itself connected to a high-voltage power supply (Ortec 556, set at 670 V) and an amplifier/single channel analyser (AMP/SCA, Tennelec TC 246). The amplifier was initially calibrated in order to make the spectrum fall in a suitable potential range. The analyser was finally connected to a counter (Ortec 996).
Gamma emission from 257.9 g of lanthanum oxide (La2O3, CAS number 1312-81-8, purchased from Strem Chemicals) with natural isotopic abundance was investigated. On considering the 138La percentage in nature, the quantity of 138La in the sample is 1.4 mmol, corresponding to 8.6 × 10²⁰ nuclei (N0). The radioactive decay follows first-order kinetics, so the activity of the sample (–dN/dt) is given by Equation 4:
\[ - {{{\rm{d}}N} \over {{\rm{d}}t}} = {{\ln 2} \over {{t_{1/2}}}}{N_0}\]
(4)
The activity of the sample considered here is around 180 Bq (Becquerel, disintegrations/second). Another common measurement unit is the Curie (Ci), corresponding to the number of disintegrations per second of one gram of 226Ra (1 Ci = 3.7 × 10¹⁰ Bq). The activity of the La2O3 sample is, therefore, around 5 × 10⁻³ µCi. The sample has very low activity, considering that a radioactive source for didactic purposes is typically around 1 µCi. To detect 138La radioactivity it is, therefore, necessary to shield the source and the scintillator from the natural radioactivity of the environment. In our experiment the La2O3 powder was placed in a polyethylene glass with a diameter of 7.1 cm. The height of the powder was 8.2 cm. The glass was introduced in a lead well with internal diameter of 8.6 cm and depth of 11.3 cm. The thickness of the walls was between 3.8 cm and 5.4 cm. The scintillator crystal was placed over the well and the side wall of the crystal was shielded with 3.1-cm-thick lead. An additional lead screen with thickness around 1.2 cm was placed around the PMT.
The gamma spectrum of La2O3 reported in Figure 3 was recorded by varying the centre of the SCA potential window with 0.1 V steps. The potential window was set to 0.1 V. The counter time was 180 min. Every measurement was carried with and without the sample in order to subtract the background. The error associated with the ordinate values was conservatively estimated by the sum of the square roots of the two counts. The inset of Figure 3 was obtained by reducing the potential steps and window to 0.05 V, while the counter time was increased to 420 min.
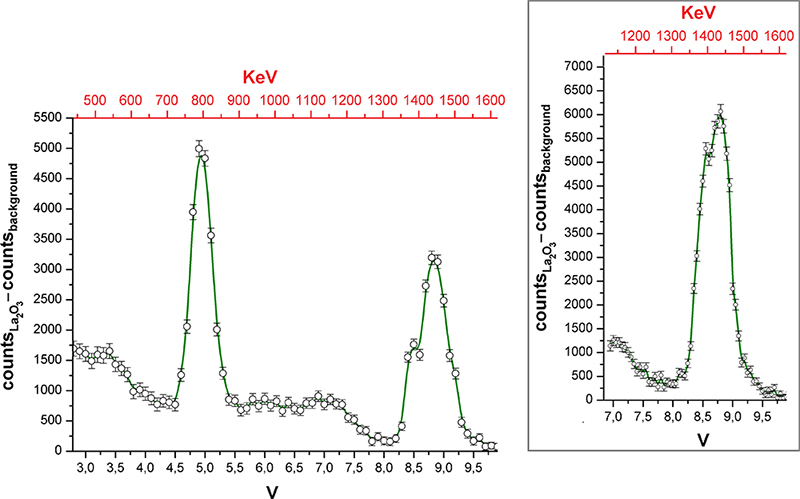
Figure 3. Gamma spectrum of La2O3. Inset: portion of the spectrum collected with improved resolution.
The gamma spectrum shown in Figure 3 highlights the presence of two main peaks, centred at 8.8 V and 4.9 V, corresponding to the gamma emissions at 1435.8 keV (EC decay) and 788.7 keV (β– decay) of 138La. The accuracy of the assignment was verified by replacing the sample with 40K (350.6 g of non-enriched KCl, gamma activity 17 × 10–3 µCi, Eγ = 1460.8 keV). On the basis of these data it was possible to roughly calibrate the abscissa scale and report it in keV. The energy resolution of the higher energy peak is around 5 %, while for the other peak it is 9 %. Because of the different sensitivity of the detector on changing the gamma photon energy, the intensities of the two peaks do not respect the relative probabilities of 138La EC and β– decays. The two peaks are accompanied by the expected Compton scattering. Probably because of the poor activity of the source, no signal related to pair production was detected. The higher energy peak shows a shoulder at lower energy, but the number of points in the spectrum is limited and the points are separated by about 17 keV. To verify the existence of the shoulder, that region of the spectrum was collected again with doubled abscissa resolution and longer counting time (see the inset of Figure 3). The shoulder was confirmed, and its energy suggests that it could be related to the escape of an iodine X-photon.
Undergraduate laboratory experiments
The experiment previously described with a SCA analyser requires too much time to be carried out in an undergraduate laboratory. On the basis of the results described, a gamma spectrum with sufficient resolution can, however, be collected overnight using a commercially available multi-channel analyser. If only a SCA is accessible, the gamma activity of the sample in the 450–1600 keV range can be unambiguously distinguished from the background in two hours (one hour measurement for the sample, another one for the background).
Besides La2O3, another source that can be safely used by students with the same experimental setup is a potassium salt such as KCl, in order to detect the gamma emission related to 40K EC decay. A useful exercise related to 40K is the calculation of the gamma activity of a potassium source (see Exercise 1). KCl can be used by the students for the rough calibration of the amplifier (see Exercise 2).
In all the cases, it is worth noting that there are no safety hazards related to radioactivity, and La2O3 and KCl are non-toxic powders.
Exercise 1
Consider a source constituted by m grams of a potassium salt having formula weight W. Search on the web for 40K data concerning half-life, natural abundance and relative probability of the EC decay. Use these data and Equation 4 to calculate the gamma activity in Bq and µCi.
Exercise 2
The potential range to collect the gamma spectrum is determined by the high-voltage supply of the PMT and the setting of the amplifier. A rule of thumb for most phototubes is that a 10 % variation of the high-voltage will change the gain by a factor of two. To calibrate the amplifier use more than 300 g of KCl as source and set a counting time around 5 min. Consider a sufficiently large potential window, e.g. 2 V. Depending upon the working range of the analyser, set the centre of the potential window at a suitable value (e.g. 8 V if the analyser works in the 0–10 V range). Start the first measurement with low voltage supply and good amplification, for example use half of the maximum values for both the settings. Record the counts and repeat the measurement by progressively increasing (about 10 % each time) the high-voltage supply. Do not exceed the PMT limit! Counts vs high-voltage supply should show a maximum. Starting from the corresponding high-voltage value, halve the amplification and carry out a new series of measurements, increasing the high-voltage supply by about 2–3 % each time. Find the new high-voltage value corresponding to the maximum counts and repeat the procedure until restricted by the PMT and amplifier limits.
Conclusions
Gamma spectroscopy on non-enriched sources is a powerful tool for safely exploring several concepts related to radioactivity, in particular:
- Basic concepts: decay modes, radioisotope half-life, units in radioactivity, activity of a source.
- Advanced concepts: gamma photons, interaction with matter, Compton scattering.
The measurements suggested here give insight into questions related to natural radioactivity in the environment. The instrumental equipment offers the possibility to work with PMTs, amplifiers and analysers that may also be encountered during other undergraduate laboratory experiments, such as those related to luminescence measurements.
Acknowledgements
Università Ca’ Foscari Venezia is gratefully acknowledged for financial support. We sincerely thank Enrico Trave and Paolo Calvelli for support.
References
- S.G. Hutchison and F.I. Hutchison, “Radioactivity in everyday life”, J. Chem. Educ. 74, 501–505 (1997). https://doi.org/10.1021/ed074p501
- H. Domenech, Radiation Safety. Springer, Basel (2017).
- Table of Radioactive Isotopes. http://nucleardata.nuclear.lu.se/toi/nuclide.asp?iZA=570138 (accessed April 2020).
- W.D. Loveland, D.J. Morrissey and G.T. Seaborg, Modern Nuclear Chemistry, 1st Edn. Wiley, Hoboken (2006).
- Table of Radioactive Isotopes. http://nucleardata.nuclear.lu.se/toi/nuclide.asp?iZA=190040 (accessed April 2020).
- Table of Radioactive Isotopes. http://nucleardata.nuclear.lu.se/toi/nuclide.asp?iZA=560437 (accessed April 2020).
- F. El-Daoushy and F. Hernández, “Gamma spectrometry of 234Th (238U) in environmental samples”, Analyst 127, 981–989 (2002). https://doi.org/10.1039/b203012h
- G.R. Gilmore, Practical Gamma-ray Spectrometry, 2nd Edn. Wiley, Chichester (2008).
- J. Prekeges, Nuclear Medicine Instrumentation. Jones & Bartlett Publishers, Sudbury (2010).