Valentina Lyubomirova,*a,b Veronika Mihaylovaa,b and Rumyana Djingovaa,b
aTrace analysis laboratory, Faculty of Chemistry and Pharmacy, University of Sofia, 1 J. Bourchier blvd, 1164-Sofia, Bulgaria. E-mail: [email protected]
bCenter of Competence “Clean technology for sustainable environment – water, waste, energy for circular economy”, Sofia, Bulgaria
The accurate determination of macroelements (Na, K, Ca, Mg and Si) in potable waters with inductively-coupled plasma mass spectrometry (ICP-MS) is difficult due to their high concentrations. In the present study, optimisation of cell-based ICP-MS for application of a bandpass parameter (RPa) for signal reduction was performed to extend their linear ranges. Individual values of the RPa for each isotope have been selected. A method for the determination of macroelements without dilution using optimised RPa values has been developed and applied for potable water analysis. The accuracy was evaluated by analyses of a surface water reference material.
Introduction
Freshwater is a finite resource, essential for agriculture, industry and human existence. The significance of clean water for human consumption, agricultural use etc. requires monitoring for both nutritional and toxic components in natural and mineral waters. In recent decades, inductively coupled plasma mass spectrometry (ICP-MS) has emerged as the most promising technique for multielement trace analysis of environmental samples. However, the direct instrumental determination of macroelements (alkaline and alkaline earth elements, as well as Si) at mg L–1 levels in natural waters and other environmental materials using ICP-MS is a challenge and is often not possible. Due to their low ionisation potential (IP) and high concentrations in environmental samples, the signal reaches the upper limit of the concentration range,1 becomes saturated and is not proportional to the concentration. Therefore, the ranges of linearity are limited to µg L–1 concentrations.
The usual approach to overcome these difficulties is either the use of another method, usually inductively-coupled plasma atomic emission spectrometry (ICP-AES) or manifold dilution of the samples. Although dilution is a common analytical practice, in this case it leads to serious problems in the determination of micro and trace elements in the same sample, which at high dilution fall below the limit of detection (LOD) of the method. Thus, more than one measurement run is necessary, which extends the duration and price of the analysis.
Apart from dilution, ICP-MS provides two possibilities which might be used: cold plasma conditions at reduced plasma input power (RF in the interval 600–800 W) and increased nebuliser gas flow (>1 L min–1) have been used for macroelement determination.2 In spite of the significant advantages, this approach requires finding optimal conditions for the determination of all macroelements, which are often present in a wide concentration range, and also separate determination of macro- and microelements in one sample.
The growing popularity of cell-based ICP-MS has allowed a solution for simultaneous determination of both macro- and trace elements. The Dynamic Reaction Cell (DRC) is a high-precision, quadrupole cell that is enclosed and may be pressurised.3 The usual application of DRC-ICP-MS is called DRC mode and aims to eliminate interferences on trace elements, leading to a significant improvement in their LODs.
Another application of the DRC is the ability to reduce the signal sensitivity for elements inside the stability region by the introduction of a bandpass parameter, RPa (DC potential applied between the pole pairs of the DRC)3 which extends the dynamic range of the instrument. This approach is usually known as standard mode with bandpass parameters. The advantage of this approach is selective suppression of the signal of elements present at high concentrations (such as Na, K, Ca, Mg, Si) and their analysis by ICP-MS without dilution. Another important advantage is the possibility for suppression of the signal sensitivity of a particular isotope without affecting the sensitivity of the remaining isotopes of the element. This possibility allows the introduction of an individual value of RPa for each individual isotope, depending on the natural abundance.
The aim of the present study is to develop a method for determination of Na, K, Ca, Mg and Si in water with DRC-ICP-MS after optimisation of RPa. The procedure will permit the direct determination of macroelements in potable water without dilution and in one run with microelements.
Experimental
Instrumentation
A PerkinElmer SCIEX DRC-e ICP-MS system with cross-flow nebuliser was used for the analysis. The optimisation of the bandpass parameter RPa for signal reduction of 23Na, 39K, 24,25,26Mg, 42,43,44Ca and 28,29,30Si was performed at normal plasma conditions (1100 W ICP RF power and nebuliser gas flow 0.89 L min–1). The lower abundant 41K and 46,48Ca isotopes were not studied because of the overlapping of 41K with 40Ar1H+, originating from the plasma and isobaric interferences of 46,48Ti on 46,48Ca.
Standards
Multielement standard solutions containing Na, K, Ca, Mg and Si in the concentration range from 0.01 µg L–1 to 200 mg L–1 were prepared from single stock solutions (Merck) with initial concentrations of 1000 mg L–1 after appropriate dilution.
Reference materials
The accuracy of the method was evaluated by the analyses of surface water reference material (RM) (SPS-SW2, Reference Material for Measurement of Elements in Surface Waters, Spectrapure Standards, Norway).
Samples
Six types of potable waters—two mineral, two spring and two table water brands—were purchased from commercial sources in Bulgaria. The water samples were analysed without any pretreatment.
Results and discussion
Dynamic range at standard conditions
Table 1 presents the linear ranges obtained by constructing calibration graphs for Na, K, Ca, Mg and Si under standard conditions. The correlation coefficients for all calibration curves were at least 0.999. The experimental results showed limited linear ranges from 0.01 µg L–1 to a maximum of 1000 µg L–1.
Table 1. Linear ranges at standard conditions and cell-based mode ICP-MS. Selected RPa values in bold.
Element/isotopic abundance (%) | Standard conditions (µg L–1) | Cell-based-ICP-MS | |
RPa (V) | Linear range (mg L–1) | ||
23Na (100.00) | 0.01–100 | 0.015 | 0.010–40 |
24Mg (78.99) | 0.01–300 | 0.015 | 0.001–50 |
25Mg (10.00) | 0.01–1000 | 0.013 | 0.001–40 |
26Mg (11.01) | 0.01–1000 | 0.013 | 0.001–25 |
28Si (92.23) | 0.01–500 | 0.014 | 0.001–15 |
29Si (4.68) | 0.01–1000 | 0.012 | 0.05–80 |
30Si (3.09) | 0.01–1000 | 0.012 | 0.010–100 |
39K (93.26) | 0.01–100 | 0.016 | 0.010–100 |
42Ca (0.65) | 0.01–200 | 0.013/0.014/0.015 | 0.010–200 |
43Ca (0.14) | 0.01–200 | 0.013/0.014/0.015 | 0.025–200 |
44Ca (2.09) | 0.01–200 | 0.013 | 0.005–50 |
Apart from the element, the established linear ranges depend on the particular isotopes used for the analysis. The following dependence was established: the lower the IP of the element and the higher relative natural abundance of the respective isotope, the narrower the linear range. It appeared to be practically impossible to determine the alkaline elements K (IP = 4.34 eV) and Na (IP = 5.14 eV) in waters under standard conditions. The linear range for both elements was limited to 100 µg L–1, while their concentrations in drinking waters are in the mg L–1 range. The direct determination of Ca (IP = 6.11 eV) using 42Ca, 43Ca, 44Ca, all of them having isotopic abundance below 2 % (only 44Ca is 2.09 %), was possible in a narrow concentration range up to 200 µg L–1. The determination of Mg with a higher IP (7.65 eV) depended on the measured isotope, e.g. when using 24Mg with relative abundance 79 %, the linear range was limited to 300 µg L–1, however, for 25Mg and 26Mg with abundances of 10 % and 11 %, respectively, it reached 1000 µg L–1. A similar trend was observed in the analysis of Si isotopes (IP = 8.15 eV), which showed linear range up to 500 µg L–1 for 28Si and up to 1000 µg L–1 for 29Si and 30Si. Thus, although ICP-MS has, in principle, at least nine orders of magnitude linear dynamic range,4 high mg L–1 levels are a challenge to measure, especially for elements with low IP and high natural abundance of the primary useful isotope, e.g. 23Na (100 %) and 39K (93.3 %).
Optimisation of RPa
In order to extend the linear ranges from µg L–1 to mg L–1, concentration interval optimisation of RPa was applied to suppress the analyte signals. Further, the ability to suppress signal intensity individually for each isotope without affecting the sensitivity of other isotopes by varying RPa was used for Ca, Mg and Si isotopes depending on the natural abundance of the particular isotope of the elements.
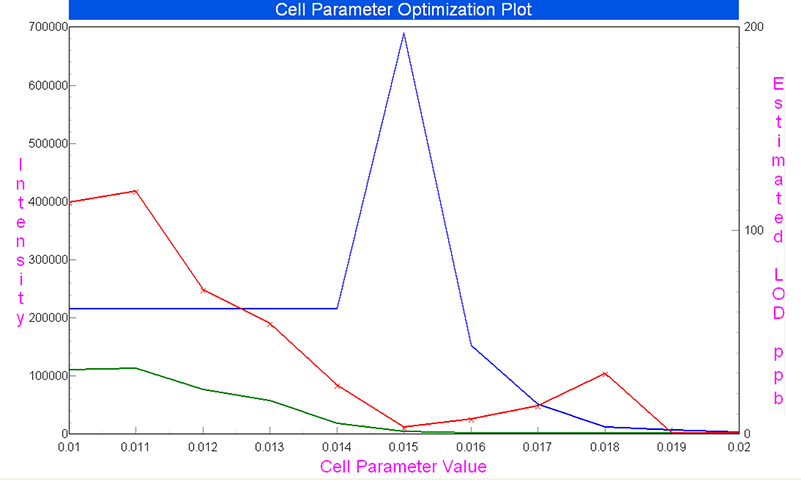
The optimisation of RPa was performed with a blank sample (deionised water) and standard solutions in the range 0.1–200 mg L–1 for each of the chosen isotopes. The optimisation curves for 23Na at concentration 10 mg L–1 are presented in Figure 1. They demonstrate that a saturated signal was achieved in the range of RPa value from 0.010 V to 0.014 V and a linear signal vs concentration was obtained at higher RPa values. The comparison of the optimisation curves for Mg and Si isotopes showed that, in order to obtain an unsaturated signal of the most abundant isotopes, 24Mg and 28Si, it was necessary to apply RPa values higher by at least 0.002 V than for the less abundant isotopes of elements.

Figure 1. Bandpass parameter RPa optimisation plot for signal intensity reduction of 23Na at concentration 10 mg L–1 (blue line: standard solution, green line: blank solution, red line: LOD).
Using mixed standard solutions, the linearity was checked by constructing calibration graphs at a concentration interval from 0.001 mg L–1 to 200 mg L–1 for each of the isotopes at three different RPa values, starting from the lowest RPa value at which an unsaturated signal was obtained. The data demonstrated that increasing the RPa value led to wider linear ranges up to 200 mg L–1. The established linear ranges are presented in Table 1. However, the selection of RPa value was made as a compromise between the expected concentration of the element in potable water samples, the degree of signal reduction and the corresponding LOD. The selected RPa value for 23Na was 0.017 V, which resulted in a higher LOD than at RPa 0.016 V, but it reduced the signal more than twice and allowed a wider linear range to be achieved. The selected RPa values of the other isotopes are presented in Table 1 in bold.
Analytical characteristics
The accuracy was checked by analysis of the surface water RM and the results are presented in Table 2. The data in Table 2 demonstrate that the application of RPa for the macroelements leads to extended linear ranges and the obtained experimental values are within the confidence interval of the RM.
Table 2. Results from the analysis of the surface water RM.
Element | Experimental value | Certified value |
Na (mg L–1) | 10.02 ± 0.04 | 10.000 ± 0.050 |
K (mg L–1) | 1.003 ± 0.008 | 1.000 ± 0.005 |
Ca (mg L–1) | 10.02 ± 0.07 | 10.000 ± 0.050 |
Mg (mg L–1) | 2.04 ± 0.06 | 2.000 ± 0.010 |
Si (mg L–1) | 5.02 ± 0.04 | 5.000 ± 0.030 |
Analysis of water samples
A quantitative method for the determination of macroelements using the selected individual RPa values was developed and applied for their determination in potable waters. The results from the analysis of six potable water brands are presented in Table 3. The determined concentrations are compared to the value given on the bottle label. The experimental results demonstrate the applicability of RPa for the direct determination of macroelements with ICP-MS in a wide concentration range without sample dilution. The closeness of the experimental values to the bottle labels confirm the reliability of the proposed method.
Table 3. Results (Average concentration ± σ, n = 3) from the determination of macroelements (mg L–1) in cell-based-mode ICP-MS in potable waters.
| Dragoy-novo | Matinée | Devin | Rosa | Rodina | Gorna bania |
Na | 35.6 ± 0.3 | 70.3 ± 0.8 | 5.89 ± 0.03 | 2.89 ± 0.05 | 59.2 ± 0.5 | 3.33 ± 0.04 |
K | 10.2 ± 0.1 | 1.03 ± 0.03 | 0.93 ± 0.02 | 0.47 ± 0.03 | 0.44 ± 0.01 | 0.28 ± 0.03 |
Ca | 36.9 ± 0.6 | 7.65 ± 0.25 | 6.02 ± 0.09 | 10.8 ± 0.9 | 7.69 ± 0.17 | 3.19 ± 0.06 |
Mg | 8.46 ± 0.05 | 2.37 ± 0.07 | 0.29 ± 0.04 | 1.03 ± 0.05 | 0.32 ± 0.01 | 0.87 ± 0.05 |
Si | 23.4 ± 0.7 | 11.2 ± 0.4 | 13.3 ± 0.2 | 6.81 ± 0.08 | 12.8 ± 0.5 | 0.81 ± 0.07 |
*bottle label value
Conclusions
The present investigation demonstrates the advantage of cell-based ICP-MS to individually select the bandpass parameter RPa for any element or element isotope and suppress the signal of the masses of interest. The possibility of varying the RPa value depending on the expected element concentration provides the possibility of determination of macroelements in various water types.
Acknowledgements
This work is part of project BG05M2OP001-1.002-0019: “Clean technologies for sustainable environment – water, waste, energy for circular economy” (Clean&Circle) 2018–2023, for development of a Centre of Competence, financed by the Operational programme “Science and Education for Smart Growth” 2014–2020, co-funded by the European Union through the European structural and investment funds.
The financial support of INFRAMAT (Modern research infrastructure in support of science, culture and technological development) for upgrade of the ICP-mass spectrometer is gratefully acknowledged. INFRAMAT is part of the National Roadmap for Scientific Infrastructure and is financially supported by the Bulgarian Ministry of Education and Science (Contract D01-155/28.08.2018 and D01-284/18.12.2019).
References
- M. Birke, C. Reimann, A. Demetriades, U. Rauch, H. Lorenz, B. Harazim and W. Glatte, “Determination of major and trace elements in European bottled mineral water — Analytical methods”, J. Geochem. Explor. 107, 217 (2010). https://doi.org/10.1016/j.gexplo.2010.05.005
- F. Bianchi, M. Careri, M. Maffini, A. Mangia and C. Mucchino, “Use of experimental design for optimisation of the cold plasma ICP-MS determination of lithium, aluminium and iron in soft drinks and alcoholic beverages”, Rapid Commun. Mass Spectrom. 17, 251 (2003). https://doi.org/10.1002/rcm.907
- S.D. Tanner, V.I. Baranov and D.R. Bandura, “Reaction cells and collision cells for ICP-MS: a tutorial review”, Spectrochim. Acta B 57, 1361 (2002). https://doi.org/10.1016/S0584-8547(02)00069-1
- D. Beauchemin, “Inductively coupled plasma mass spectrometry methods”, in Encyclopedia of Spectroscopy and Spectrometry, 3rd Edn, Ed by J.C. Lindon, G.E. Tranter and D.W. Koppenaal. Academic Press, Oxford, p. 236 (2017). https://doi.org/10.1016/B978-0-12-409547-2.11222-3


