Johannes Hesper
Shimadzu Europa GmbH, 47269 Duisburg, Germany
The ICH Harmonised Guideline, Guideline for Elemental Impurities (ICH Q3D) of drug products,1 requires control of the residual amounts of 24 elements whose toxicities are of concern. This requirement has applied to new drug products since June 2016 in the United States and Europe, and since April 2017 in Japan. Application to existing drugs began in January 2018 in the United States, and in December 2017 in Europe.
Although the recommended analytical methods for elemental impurities are inductively coupled plasma-atomic emission spectrometry (ICP-AES) and ICP-mass spectrometry (ICP-MS), the use of appropriate alternative methods is also permitted when such methods exist. This article describes an investigation to verify the appropriateness of energy dispersive X-ray fluorescence (ED-XRF) spectrometry as an alternative to the methods mentioned above with reference to the United States Pharmacopeia (USP).
The instrument used was an EDX-7000 with the Pharmaceuticals Impurities Analysis Method Package (Shimadzu). Quantitative analysis was executed by the calibration curve method with standard sample aqueous solutions using two types of drug substance in powder form as the test materials. The results were satisfactory, confirming the possibility of using ED-XRF for controlling elemental impurities of drug products.
Elements
ICH1 divides the impurities into three main classes based on their toxicities (PDE, permitted daily exposure) and their likelihood of occurrence in the drug product.
Class 1: The elements arsenic (As), cadmium (Cd), mercury (Hg) and lead (Pb) are human toxicants that have limited or no use in the manufacture of pharmaceuticals. Due to their unique natures, these four elements require evaluation during the risk assessment, across all potential sources.
Class 2: Elements in this class are generally considered as route-dependent human toxicants. Class 2 is subdivided into two subgroups 2A and 2B.
Class 2A elements have relatively high probability of occurrence in the drug product and thus require risk assessment across all potential sources.
Class 2B elements have a reduced probability of occurrence in the drug product related to their low abundance and low potential to be co-isolated with other materials.
Class 3: The elements in this class have relatively low toxicities by the oral route of administration (high PDEs, generally > 500 µg d–1).
The Pharmaceuticals Impurities Analysis Method Package enables analysis of the following 12 elements among those specified in the ICH Q3D. These elements have high importance in the control of elemental impurities.
Class 1: As, Cd, Hg, Pb (arsenic, cadmium, mercury, and lead)
Class 2A: V, Co, Ni (vanadium, cobalt, nickel)
Class 2B: Ru, Rh, Pd, Ir, Pt (ruthenium, rhodium, palladium, iridium, platinum)
Evaluation samples
Benazepril hydrochloride and Captopril drug substance powders were used. Table 1 shows their details and the daily amount of drug product.
Concept of control values
- Setting of a maximum permitted concentration: the ICH Q3D stipulates the PDE for each element; when evaluating the elemental impurities in a drug product or its constituent ingredients, the PDE value must, therefore, be converted to a concentration. The conversion methods in the ICH Q3D are defined in classes 1, 2a, 2b and 3. In this assessment, the daily amount of drug product was 300 mg, higher than the specified value in Table 1, in order to validate the lower concentration range. Values for oral preparations were used as PDE values, and the equation in Table 2 was used to convert them.
- Setting of spike concentration: because the ICH Q3D defines 30 % of the PDE value as the control threshold, 30 % of the maximum permitted concentration in Reference 1 was determined as the control value. The spike concentration was set at 50 % of the control value in accordance with the USP. Table 2 shows the relationship of the PDE value, maximum permitted concentration and spike concentration.
Table 1. Evaluation samples and structural formulae.
| Benazepril hydrochloride | Captopril |
Compositional formula | C24H28N2O5·HCl | C9H15NO3S |
Atomic weight | 460.95 | 217.29 |
Structural formula |
|
|
Daily amount of drug product | 10 mg d–1 | 150 mg d–1 |
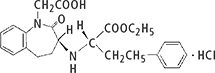
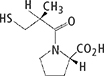
Table 2. PDE values and spike concentrations.
| PDE value (A) | Max. permitted concentration (B) = A / 0.3 | Spike concentration Bx = 0.3 / 2 |
Element/unit | µg d–1 | µg g–1 | µg g–1 |
Pb, Cd | 5 | 16.7 | 2.5 |
As | 15 | 50 | 7.5 |
Hg | 30 | 100 | 15 |
Co | 50 | 167 | 25 |
V, Ir, Pt, Ru, Rh, Pd | 100 | 333 | 50 |
Ni | 200 | 667 | 100 |
Standard samples
Five standard samples were prepared from each of the following two mixed standard solutions: XSTC-2046 and USP-TXM4 (manufactured by SPEX).
Sample pretreatment
- Preparation of spiked samples: a standard solution for atomic absorption or cellulose powder with high content was added to the evaluation sample at an added concentration and mixed uniformly to prepare the added sample.
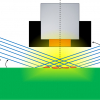
- Presentation of samples: as shown in Figure 1, the samples were introduced into a sample container lined with a polypropylene film and were then measured.
![]()
Figure 1. Samples prepared for measurement.
Validation results
Validation was conducted for the USP requirements of accuracy, precision, specificity, quantitation limit, linearity and robustness. Table 3 shows an outline of the USP validation procedure, together with the validation results in this experiment. Tables 4 to 8 and Figures 2 and 3 show the results for each item. As an example, four elements were taken (As + Hg Class 1, Ni Class 2A and Ru Class 2B) to show the performance of the method. More details can be found elsewhere.2
Table 3. Outline of USP validation results.
Requirement | Method | Acceptance criterion | Results | Judgement |
Accuracy | Quantitative analysis by calibration | Recovery rate 70.0–150.0 % | Recovery rate 92–108 % | pass |
Curve method | ||||
Spike and recovery test | ||||
Precision | Spiked samples: 3 | RSD ≤ 20.0 % | RSD ≤ 5.8 % | pass |
3 replicate measurements for 3 samples | ||||
Relative standard deviation (RSD) of | ||||
Total of 9 quantitative analyses | ||||
Specificity | Quantitative spectrum is clearly separated and distinguishable from the spectrum of matrix component | RSD ≤ 20.0 % | Quantitative spectrum was separated from matrix component | pass |
Satisfied accuracy | ||||
Quantitation limit | Repetition of quantitative analysis 6 replicate measurements of unspiked sample | Satisfy max. 50 % of control value and Accuracy and Precision conditions | Estimated value < 50 % of control value (= spike concentration) | pass |
Estimated value of 10× the standard deviation | Satisfied Accuracy and Precision | |||
Linearity | Standard samples: 5 | ≥0.99 | Correlation coefficient R ≥ 0.9941 | pass |
Regression line by least squares method | ||||
Robustness | Sample quantity shall be used as experimental parameter | Change rate of quantitative value after change of experimental value shall be within 20.0 % | Change rate of quantitative value: –12.0 % to + 8.3 % | pass |
Table 4. Accuracy (µg g–1).
| Class 1 | Class 2A | Class 2B | ||
Element | As | Hg | Ni | Ru | |
Spike concentration | 7.5 | 15 | 100 | 50 | |
Benazepril hydrochloride (RSD) | Spiked sample | 7.2 | 14.9 | 104.2 | 53.0 |
Unspiked sample | < 0.5 | < 0.3 | < 0.7 | < 0.4 | |
Recovery rate (%) | 96 | 99 | 104 | 106 | |
Capropril | Spiked sample | 7.2 | 13.8 | 94.5 | 52.6 |
Unspiked sample | < 0.5 | < 0.4 | < 0.8 | < 0.4 | |
Recovery rate (%) | 96 | 92 | 95 | 105 | |
Table 5. Precision (%).
| As (RSD) | Hg (RSD) | Ni (RSD) | Ru (RSD) |
Benazepril hydrochloride | 0.5 | 0.4 | 0.3 | 0.8 |
Captopril | 2.3 | 0.8 | 1.1 | 0.6 |
Table 6. Estimated value of quantitation limit (µg g–1).
| As (RSD) | Hg (RSD) | Ni (RSD) | Ru (RSD) |
Benazepril hydrochloride | 0.2 | 0.4 | 0.9 | 0.3 |
Captopril | 0.1 | 0.4 | 0.9 | 0.3 |
Table 7. Linearity (µg g–1).
| As | Hg | Ni | Ru |
Correlation coefficient | 0.9998 | 0.9999 | 0.9999 | 0.9999 |
Table 8. Robustness (µg g–1). More concentrations were measured but are not shown here.
| As | Hg | Ni | Ru | |
Taken from Table 5 | 2.0 g standard | 7.2 | 14.9 | 104.2 | 53.0 |
Benazepril hydrochloride | 0.5 g | 6.7 | 14.9 | 104.4 | 49.3 |
Change rate | –6.9 % | 0.0 % | +0.2 % | +1.7 % | |
Taken from Table 6 | 2.0 g standard | 7.2 | 13.8 | 94.5 | 52.6 |
Captopril | 0.5 g | 7.3 | 13.6 | 96.3 | 54.7 |
Change rate | +1.4 % | –1.4 % | +1.9 % | +4.0% | |
![]()
Figure 2. As, Hg, Ni and Ru in Benazepril. Four examples of Benazepril hydrochloride ED-XRF results [cps = counts per seconds (µA)]. Blue: spiked sample, Red: unspiked sample.
![]()
Figure 3. As, Hg, Ni and Ru in Captopril. Four examples of Captopril EDX results. Blue: Spiked sample, Red: unspiked sample.
Appropriateness of spiked samples and concentrations
For the validation of the appropriateness of the spiked samples and their concentrations, unspiked samples and spiked samples were analysed by ICP-MS (ICPMS-2030, Shimadzu). Part of the sample (powder) was digested with a microwave digestion system and dissolved into solution. The measurement solutions were diluted by 5000 times from the solid sample for the Class 1 and Class 2A samples, and by 25,000 times for the Class 2B samples. Table 9 shows the ICP-MS analysis results. Because both of the types of drug substance samples were close to the spike concentrations, it can be assumed that the spiking and homogenisation of the evaluation samples were conducted properly. In addition, the appropriateness of the measurement results was also confirmed for the unspiked samples.
Table 9. ICP-MS analysis results (average value for n = 2) (µg g–1).
| Class 1 | Class 2A | Class 2B | ||
Element | As | Hg | Ni | Ru | |
Spike concentration | 7.5 | 15 | 100 | 50 | |
Benazepril hydrochloride (RSD) | Spiked sample | 7.1 | 15 | 99.0 | 50.0 |
Unspiked sample | < 0.2 | < 0.1 | 0.3 | < 0.05 | |
Captropril | Spiked sample | 7.3 | 15.0 | 99.8 | 49.4 |
Unspiked sample | < 0.2 | < 0.1 | < 0.2 | < 0.05 | |
< indicates that the value was less than the conversion lower limit of determination (10 σ) for the drug substance (unspiked) powder. Less than the conversion lower limit of determination (10 σ): lower limit of determination (10 σ) in measurement solution × dilution rate (Class 1, 2A: 5000×, Class 2B: 25,000×).
Table 10. ED-XRF measurement conditions (Pharmaceuticals Impurities Analysis Method Package).
Instrument | EDX-7000/EDX-7000P |
Elements | As, Hg, Pb, Cd, V, Co, Ni, Ir, Pt, Ru, Rh, Pd |
Collimator | 10 (mmψ) |
Primary filter | Used |
Atmosphere | Air |
Conclusion
This experiment demonstrated the effectiveness of ED-XRF as an alternative to ICP-AES/ICP-MS in the ICH Q3D elemental impurities analysis of drug substance samples. Validation and verification results were satisfactory even for Captopril, which has a high sulfur content of approximately 15 %. The effectiveness of this method package, which produces calibration curves using standard aqueous solution samples, was also confirmed. Based on these results, it is considered possible to apply this method to control various types of drug substances and drug products. Because there are cases in which the concentration limit for analysis by ED-XRF depends on the daily amount of drug product of 1 g, selectively combined operation with ED-XRF, corresponding to the type of drug substance and intake amount, is considered useful for efficiency and cost reduction.
References
- ICH International Council for Harmonisation of Technical Requirements for Pharmaceuticals for Human Use, Harmonised Guideline, Guideline for Elemental Impurities Q3D (R1) (Final version Adopted on 22 March 2019), https://www.ema.europa.eu/en/documents/scientific-guideline/internation…
- Application note Shimadzu X.271 (LAAN-A-XR-E044).