Antonino Cosentino
Cultural Heritage Science Open Source, chsopensource.org, Aci Sant’Antonio, Italy. E-mail: [email protected]
Multispectral imaging (MSI) systems1 are being used more and more often by art conservators and conservation scientists. They are used to map and identify pigments, binders and retouches on works of art. They are also used to visually enhance old and faded documents. These systems are becoming popular in this field because they are simple, affordable, lightweight and small. Sampling on important works of art is not possible and this is the main reason why only non-invasive techniques, such as MSI, are becoming increasingly popular to assist with undertaking conservation decisions.
MSI for art conservation is performed with a variety of equipment. It is likely, though, that its spreading in this field would be boosted by its most affordable setup: a monochromatic camera and a set of a few bandpass filters. This simple setup is versatile and can be applied to different tasks in terms of the size of the objects to be examined and documented. An MSI camera can be used with a panoramic head to study large artworks such as a series of frescoes, as well as with macro lenses to study such as small historical postage stamps. It can even be used for the examination of tiny chips of sampled paint under a stereomicroscope and also with a compound microscope to examine a single grain of pigment.
It must be noted, however, that when pigments are mixed or glazed, the method does not provide conclusive identification and invasive and non-invasive analytical examinations are necessary in order to obtain more detailed and conclusive information. The use of MSI to tentatively identify pigments has an important advantage, justifying its application: the rapid and low-cost survey of large areas.
The spectral cube
A reflectance spectrum shows for each wavelength the ratio between the intensity of the reflected light and the incident light, measured with respect to a standard white reference. This ratio is called reflectance and is given in percentage (%). Reflectance spectra can provide information useful for the identification of pigments since the light that is not reflected is absorbed or transmitted depending on the chemical composition of the material tested. The reflectance spectral features of materials in the UV/vis range are attributed to electronic transitions while those in the near infrared (NIR) range to fundamental vibrational overtones and combination modes. Analysis by reflectance spectroscopy is based on building up an appropriate reference spectra database, in the case of art examination, a reflectance spectra database of historical pigments.2,3
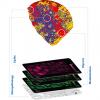
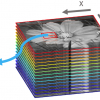
Reflectance spectral images are acquired with a monochromatic camera, which can be either a charge-coupled device (CCD) or a complementary metal-oxide semiconductor (CMOS) image sensor for the UV-vis-NIR (about 360–1100 nm) range or a more costly InGaAs camera for the NIR (900–1700 nm) range. The system is completed with an appropriate wavelength selection system in order to acquire a series of spectral images of a scene that are first registered and calibrated. These are then loaded into a spectral cube and the reflectance spectra from each pixel of the image can be reconstructed (see, for example, Figure 1).
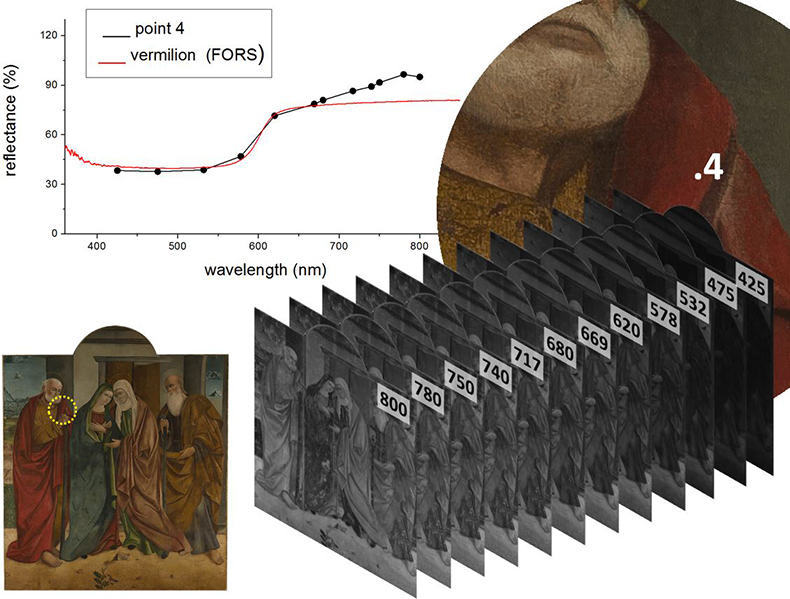
Figure 1. Spectral cube. The 12 spectral images are stacked in the spectral cube where the x and y axes represent a point on the image and the z axis shows its reflectance over each spectral image. The reconstructed reflectance spectrum of the red paint (point 4) is compared with the reference reflectance spectrum of vermilion, an historical red pigment (mercury sulfide). The subject is the painting by Antonino Giuffré, Visitation between Saint Joseph and Saint Zachary, panel painting, dated 1480–1490, cathedral of Taormina, Sicily.
Wavelength selectors
The spectral images reported in this article were acquired with a filter-wheel PixelTeq SpectroCam VIS camera (5 Megapixel CCD) covering the range 360–1000 nm. A set of 12 filters was selected for the specific task of mapping and tentatively identifying historical pigments. These systems are called multispectral or hyperspectral imagers, the difference depends on the number of spectral images produced; less than a dozen for the first, and many more for the hyperspectral systems which can use tunable filters [liquid-crystal tunable filters (LCTFs) or an acousto-optical tunable filter (AOTF)] or grating spectrometers to provide hundreds of spectral images. Also tested was the possibility to use an RGB (red-green-blue) digital camera rather than a monochromatic system.
Identifying pigments
Most of the electronic transitions in the blue and green regions are broad and therefore can be recorded at low spectral resolution even with very large bandwidth filters (50 nm). On the other hand, most of the sharp inflection points of the yellow and red pigments, as well as the characteristic S-shape of the iron-based earths, occur in the red and infrared regions that, consequently, need higher resolution (bandwidth 10 nm). The filter set chosen for the case studies in this article is composed of 12 filters (centre wavelength/bandwidth nm): 425/50, 475/50, 532/16, 578/10, 620/10, 669/10, 680/10, 717/10, 740/10, 750/10, 780/20, 800/10. In the blue region the characterising spectral features are broad and vary only slowly with wavelength. Azurite and ultramarine are the most used historical blue pigments and they have reflectance maxima very close to each other at about 460 nm. On the other hand, the two pigments can be distinguished due to ultramarine’s higher reflectance in the infrared region.
In the green region the narrow filter at 532 nm is useful to examine the reflectance maxima of some widely used green pigments. Indeed, this filter is centred at the reflectance maxima of malachite and chrome green. Verdigris, as malachite, another important copper-based pigment, has its reflectance maximum more close to the blue, at about 500 nm.
The region between the far-red and the NIR requires higher resolution and it is covered with two-thirds of the 12 filters: seven filters (669, 680, 717, 740, 750, 800 nm), six with a bandwidth of 10 nm and one filter centred at 780 nm with bandwidth 20 nm. The combination of these filters allows one to reconstruct the absorption bands in lithopone, a mixture of barium sulfate, a good flat reflector,4 and zinc sulfide, which is responsible for absorption bands in the 650–800 nm region. The most challenging task for these 12 filters is to reconstruct the S-shape of yellow and red ochre which spans from the green region to the infrared.
The identification of pigments becomes more effective when observing the features of the reconstructed spectra across all of the vis-NIR spectrum rather than focusing on specific regions. Smalt is characterised by its large absorption band between the blue and the infrared regions and by its high reflectance in the infrared. These features, as well as its reflectance maximum in the blue region at about 415 nm, distinguish smalt from other blue pigments that reflect also in the infrared, such as ultramarine. Figures 2 and 3 show pigments mapping on a mock-up painting and a 14th century icon realised with the described system.
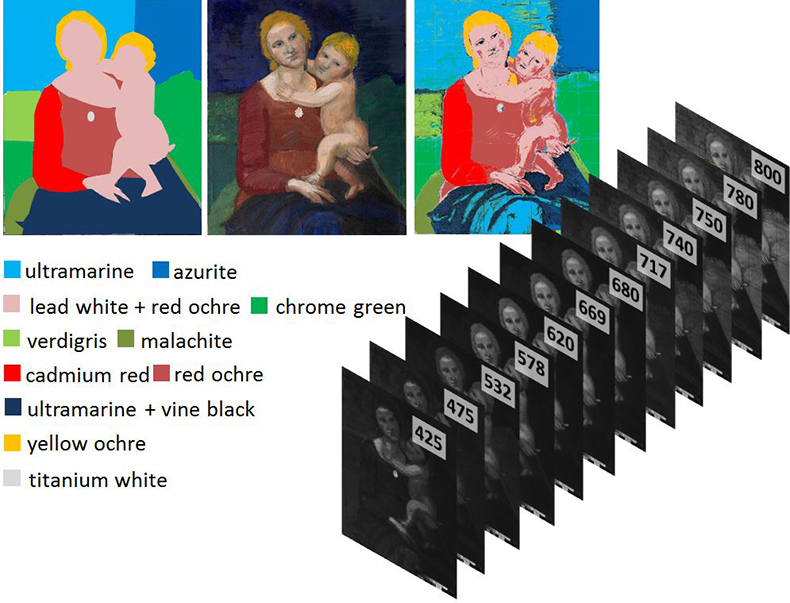
Figure 2. Pigments identification and mapping. A mock-up of a renaissance painting painted with renaissance and modern pigments in order to simulate a painting that has been heavily restored and retouched. Top, left, map of the pigments used and their legend. Top, middle, the finished painting. Top, right, the computer-assisted pigments map reconstructed from the 12 spectral images. The spectral cube software analyses pixel by pixel all the 12 spectral images and groups together pixels that have similar reflectance spectrum. The sky was painted partly in ultramarine and partly in azurite. Three different green pigments were applied on the background: verdigris, malachite and modern chrome green. The shirt was painted with red ochre, but its right sleeve with modern cadmium red. This spectral cube software was able to distinguish the two blue pigments, the three greens and was able to identify the cadmium red sleeve.
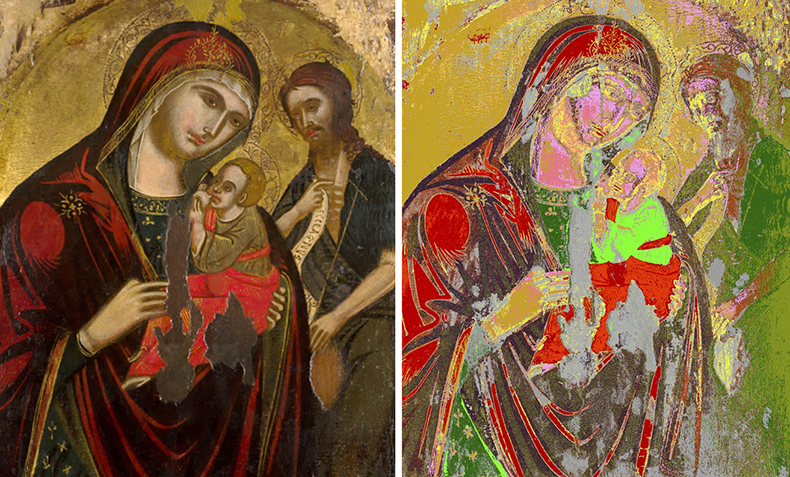
Figure 3. Pigments map. This map is obtained from 12 spectral images and it shows the areas that have been repainted (grey). The other colours indicate pigments and mixtures with comparable spectral features. Virgin with the Child and a Saint, 14th century, unknown author, Public Library of Taormina (Sicily)
Panoramic, macro and micro operations
An important and relevant feature of the MSI camera is that, due to its lens adapter, it can accommodate normal photographic lenses, expanding the possible applications of the system for the examination of works of art. The relatively small pixel counts of CCD cameras do not provide enough resolution for the spectral imaging documentation of large works of art. Therefore, it is necessary to acquire a number of images across the subject and then mosaic them in order to achieve sufficient resolution. This task can be achieved coupling the MSI camera to an automatic panoramic head to acquire the images with the panoramic photographic method.5 On the other hand, the MSI camera can be equipped with a macro lens and the examination of small objects becomes possible, such as, as mentioned earlier, historical postage stamps. Also, it can even be coupled to a stereomicroscope (see Figure 4) and a compound microscope (see Figure 5). This last setup can be used to obtain multispectral images of slide-mounted samples, which is useful, for example, for the identification of each grain of pigment. This application is particularly valuable for the analysis of a mixture of pigments since their reflectance spectra can be used to separately identify the components.
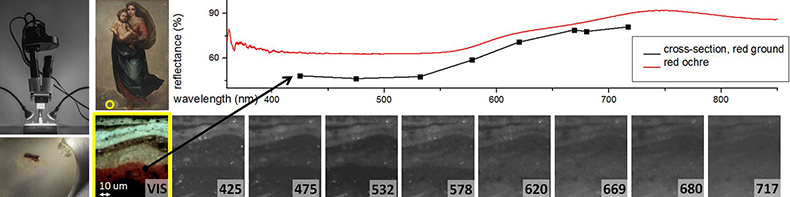
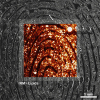
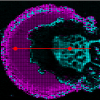
Figure 4. Stereomicroscope and MSI. The camera is coupled to a stereomicroscope (top left) to examine a cross-section of a chip of paint embedded in epoxy resin (bottom left). The spectral images allow one to reconstruct the reflectance spectrum of the red ground showing part of the S-shape characteristic of red ochre. Anton Raphael Mengs (1728–1779), Madonna and Child, KODE, Art Museums of Bergen, Norway.
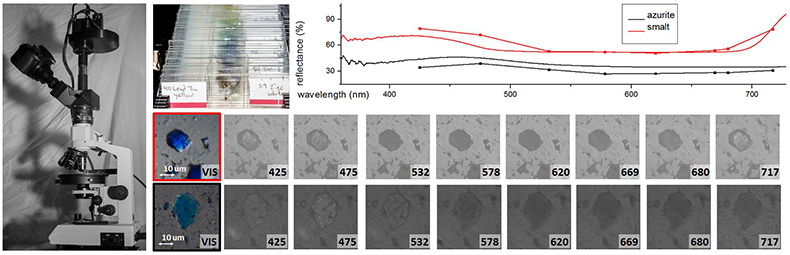
Figure 5. Microscope and MSI. The multispectral camera can be coupled to a compound microscope (left) and used to observe slide mounts of pigments (top centre). Some grains of pigments can be extracted from the surface of a painting or even from a layer of paint in a cross-section sample and can be mounted with a resin on a microscope slide. The MSI camera attached to the microscope can reconstruct the reflectance spectra of each pigment grain. The reconstructed spectrum of a grain of azurite features its maximum at about 450 nm while that of smalt shows the broad absorption band between the blue and infrared regions.
Acknowledgements
The images of the art works presented in this article are provided thanks to the courtesy of: Soprintendenza per i Beni Culturali di Messina, the director of the restoration project, Dr Grazia Musolino, and Angelo Cristaudo, restorer in Acireale, (Sicily) for the Visitation between Saint Joseph and Saint Zachary of Antonino Giuffré; the Public Library of Taormina (Sicily) for the icon Madonna with the Child and a Saint, the KODE, Art Museums of Bergen, Norway for Madonna and Child. This work has also been possible thanks to PixelTeq which kindly provided the SpectroCam VIS and the filters set.
References
- H. Liang, “Advances in multispectral and hyperspectral imaging for archaeology and art conservation”, Appl. Phys. A 106, 309–323 (2012). doi: http://dx.doi.org/10.1007/s00339-011-6689-1
- A. Cosentino, “FORS spectral database of historical pigments in different binders”, e-Conservation Journal 2, 57–68 (2014). http://e-conservation.org/issue-2/36-FORS-spectral-database
- IFAC-CNR Online Database, Fiber Optics Reflectance Spectra (FORS) of Pictorial Materials in the 270–1700 nm range, http://fors.ifac.cnr.it (Accessed 26 March 2015).
- A. Cosentino, “Identification of pigments by multispectral imaging a flowchart method”, Heritage Science 2, 8 (2014). http://www.heritagesciencejournal.com/content/pdf/2050–7445–2-8.pdf
- A. Cosentino, M.C. Caggiani, G. Ruggiero and F. Salvemini, “Panoramic multispectral imaging: training and case studies”, Belgian Association of Conservators Bulletin, 2nd Trimester, 7–11 (2014). http://www.brk-aproa.org/uploads/bulletins/BULLETIN%202–14%20kleur.pdf