Patrick Garidel
Boehringer Ingelheim Pharma GmbH & Co. KG, Process Science, Protein Science, Biberach an der Riss, Germany. E-mail: [email protected]
Download Supplementary Material PDF: Full Text PDF (542.24 Kb)
Introduction
Protein pharmaceuticals, also known as biologics, are parenterals and, in most cases, are applied via infusion or injection through a sub-cutaneous application. Protein pharmaceuticals are very sensitive drugs, prone to a number of degradations and, as a consequence, complex analytical procedures are required to fully assess their product quality. The pharmaceutical quality of biologics is a key property necessary to their safety and efficacy. Over the last few years, the presence of particles and protein aggregates has received increased attention from academia and industry, as well as regulators. In particular, the potential presence of proteinaceous particles and protein aggregates are linked with inducing severe biological consequences such as immunogenicity, altered bioactivity or altered pharmacokinetics. A number of methods and strategies for the investigation, analysis and characterisation of particles have been reported.1,2
The term particles, as used in this article, includes un-dissolved species, other than gas bubbles, that are unintentionally present in the product.2 Therefore, the term particles covers foreign and extrinsic particles as well as proteinaceous and protein particles and aggregates.
Although a number of methods are available for counting particles, their identification and chemical characterisation is more challenging, especially for the analysis of single particles in the µm size range or lower.
In a number of studies, it has been shown that spectroscopic techniques are powerful methods for the characterisation of biologics and the investigation of the formation of protein aggregates and particles.2,3,4 However, in most cases, usually only the bulk properties of the investigated samples are derived from such measurements.
Analytical methods that have been used or have the potential for the chemical analysis of single particles include energy-dispersive X-ray spectroscopy (EDX), Raman and infrared micro-spectroscopy and, in specific cases, fluorescence microscopy, whereas particle morphology is currently usually assessed by either optical microscopy, flow imaging microscopy (FIM), atomic force microscopy (AFM), or electron microscopy (EM).5,6
While vibrational techniques such as infrared micro-spectroscopy have been successfully used in medical diagnostics, for example, the characterisation of tissues and single cells,7,8,9,10,11 the application of infrared micro-spectroscopy in pharmaceutical biotechnology, especially for single particle characterisation, is not common.
Therefore, this article (together with the Further Reading on-line section, see below, http://tinyurl.com/GaridelSupp) describes the potentials, methods, some applications and trends for the use of mid-infrared (spectral range: 4000–400 cm–1) micro-spectroscopy for the investigation and chemical characterisation of single particles in protein pharmaceutics. (Near infrared micro-spectroscopy applications will not be covered). More background information (supplementary information) and references to these mid-infrared micro-spectroscopy approaches and practices as well as associated instrumentation may be read on-line at: http://tinyurl.com/GaridelSupp.
Infrared micro-spectroscopy
Sample preparation
A major challenge to the analysis requirements is the isolation of a particle sample, especially for very small particles. As described recently, in general, a liquid containing the sample [for example, particle(s)] has to be carefully filtered by using a gold filter with a specific pore size (for example 5 µm) and washed.6 The isolated particle(s) is then dried on the filter and directly examined on the gold-coated substrate. Although this procedure sounds simple, it can be very challenging to isolate small particles that are suspended in a liquid, because one has to make sure not to lose the particle(s), which may stick to all surfaces, as well as avoiding destroying of the particle(s). For such investigations, it is recommended that particle isolation is performed under a clean air environment, in order to avoid external particle contaminations. However, if the particle of interest is too small, for example smaller than 5–10 µm in diameter, it becomes very difficult to characterise the particle by single spot infrared micro-spectroscopy.
Data evaluation
For the chemical identification of particles or sample spots, it is necessary to build up an appropriate database which is based on potential contaminants or materials. Therefore, potential sources of particle formation have to be identified and reference samples obtained for infrared micro-spectroscopic evaluations. Furthermore, especially for chemical imaging data evaluation, a variety of algorithms can be usefully applied such as correlation with pure component spectra, cluster analysis, or principle component analysis (PCA), just to name a few.12
Example results and applications
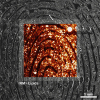
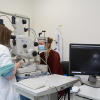
Figure 1 shows an example of an infrared micro-spectroscopy set-up (Hyperion, Bruker Corporation) which can be used for single point spectroscopy [either transmission or attenuated total reflection (ATR) mode] or for mapping experiments. The microscope is interfaced to a Fourier transform infrared (FT-IR) spectrometer. Using an ATR set-up, an internal pressure sensor ensures an optimal sample-to-ATR crystal contact during data acquisition. In the inset of Figure 1, a whitish particle of ca 30 µm in diameter is shown. The microscope aperture was set to 20 µm × 20 µm, resulting in an effective ATR sampling area of 4 µm × 4 µm, and the corresponding single-spot infrared spectrum (spectral resolution of 4 cm–1, 128 scans) is shown in Figure 2(a), #1.

To aid identification of the chemical composition and nature of the particle, different reference spectra originating from potential sources are also shown in Figure 2(a). Spectrum #2 represents a native protein sample, #3 a thermal denatured protein, while #4 originated from a polymeric seal. Comparison with the spectrum (#1) of the unknown particle shows that the particle is composed of protein and the seal polymer. A more detailed investigation of the amide I band region (1600–1700 cm–1), which allows for the determination of the protein secondary structure elements (alpha-helix, beta-sheet content etc.) and, thus, changes in protein secondary structure gives further insight in the protein conformation [Figure 2(b)].13 The native protein structure shows a band maximum at 1655 cm–1 (#2Z), whereas the amide I of the denatured protein is characterised by two band maxima located at 1650 cm–1 and 1620 cm–1 (#3Z). A similar feature is observed for the protein [Figure 2(b), #1Z] in contact with the polymer material. Thus, the particle was identified as a mixture of denatured protein and polymer.
![Figure 2. (a) Mid-infrared spectrum (1) of a particle investigated by single particle mid-infrared micro-spectroscopy (50 µm × 50 µm). Various reference spectra are shown to help identify the potential source of the particle: (2) mid-infrared spectrum of a native protein, (3) mid-infrared spectrum of a denatured protein, (4) mid-infrared spectrum of a polymer particle. (b) Zoom on the amide I band (1600–1700 cm–1) of spectra [1–3 of Figure 2(a)]: (1Z) investigated particle, (2Z) native protein and (3Z) denatured protein.](/sites/default/files/articles/IR-25-1-F2.jpg)
An example of another particle investigated by ATR micro-spectroscopy as a single spot (50 µm × 50 µm) is shown in Figure 3 (spectrum #1). Comparison with a reference spectrum obtained from a protein sample (Figure 3, spectrum # 2), shows that the particle is not proteinaceous. A database search has identified two potential sources: spectrum #3 originates from a primary packing rubber stopper and spectrum #4 from a detergent present in the drug product (Figure 3). Correlation maps and scores (data not shown here) were generated to show the probability of source origin.

Infrared micro-spectroscopic experiments may be run in either transmission or reflection mode. By comparing transmission spectra with, for example, ATR spectra of exactly the same sample, one will observe intensity changes as well as band distortions. These are due to the wavelength-dependent depth penetration in ATR. However, this can easily be corrected as most current spectrometers have transformation software procedures for converting ATR spectra to transmission spectra and vice versa (see supplementary information, http://tinyurl.com/GaridelSupp).
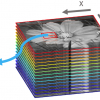
A mapping experiment is based on the fact that a high precision computer-controlled microscope stage is used to precisely translate a sample in the x and y directions. At consecutive positions across the surface of the sample, a single point measurement is preformed and a single spectrum recorded. The investigated single point area of the sample is defined by the aperture of the microscope [illustrated in Figure 4(a) ]. Thus, using the mapping approach, the entire sample surface can be raster scanned and, if required, a mosaic (tiled) false-colour or grey-scale image generated.
Using the mapping approach, the black particle shown in Figure 4(a) was analysed. In this analysis example, up to 30 single-spot spectra were taken (each ca 100 µm in size at a spectral resolution of 4 cm–1, 100 scans). Three exemplifying selected spots with their corresponding spectra are shown in Figure 4(b), indicating that the sample chemistry, in this case, is quite homogeneous. A chemical image (not shown) of the sample can be generated to illustrate this.

Examples of current trends in the field of mid-infrared micro-spectroscopy are reported in the supplementary information (see download link above) of this paper.
Conclusions
Over the last few years, a number of various applications in life and material sciences have shown how powerful FT-IR micro-spectroscopy and imaging are for the analysis of samples at a lateral spatial ratio in the µm range, allowing for a full chemical characterisation of a sample via its mid-infrared spectrum. For unequivocal chemical particle characterisation and identification, an appropriate infrared spectral database needs to be set up. A big challenge for the chemical characterisation of small samples is safe sample preparation and especially their isolation and containment. Furthermore, new, user-friendly instruments become available at reasonable cost. Using a single-spot infrared micro-spectroscopic measurement technique, samples down to ca 10 µm in diameter can be routinely and successfully analysed. Using focal plane array detectors, even smaller particle sizes (1–5 µm) may potentially be characterised.
Acknowledgements
Heidrun Schott and Ingrid Auernhammer are acknowledged for their excellent technical assistances, Werner Kliche and Andrea Herre for ongoing fruitful discussions, Anne Karow, Matthias Boese, Andreas Kerth and Joey Studts for critical reading of the manuscript.
References
- J. den Engelsman, P. Garidel, R. Smulders, H. Knoll, B. Smith, S. Bassarab, A. Seidl, O. Hainzl and W. Jiskoot, “Strategies for the assessment of protein aggregates in pharmaceutical biotech product development”, Pharmaceut. Res. 28(4), 920 (2011). doi: 10.1007/s11095-010-0297-1
- H.C. Mahler and W. Jiskoot (Eds), Analysis of Aggregates and Particles in Protein Pharmaceuticals. John Wiley & Sons Inc., Hoboken, New Jersey, USA (2012). doi: 10.1002/9781118150573
- P. Garidel, “Steady-state intrinsic tryptophan protein fluorescence spectroscopy in pharmaceutical biotechnology”, Spectrosc. Eur. 20(4), 7 (2008).
- P. Garidel, “Right angle light scattering protein thermostability screening: from research to development“, Spectrosc. Eur. 24(1), 13 (2012) and Spectrosc. Asia 8(1), 11 (2012).
- B. Demeule, R. Gurny and T. Arvinte, “Detection and characterisation of protein aggregates by fluorescence microscopy”, Int. J. Pharm. 329, 37 (2007). doi: 10.1016/j.ijpharm.2006.08.024
- P. Garidel, A. Herre and W. Kliche, “Microscopic methods for particle characterisation in protein pharmaceuticals”, Chapter 12 in Analysis of Aggregates and Particles in Protein Pharmaceuticals, Ed by H.C. Mahler and W. Jiskoot. John Wiley & Sons Inc., Hoboken, New Jersey, pp. 269–302 (2012).
- P.R. Griffiths, “Infrared and Raman instrumentation for mapping and imaging”, in Infrared and Raman Sepctroscopic Imaging, Ed by R. Salzer, H.W. Siesler. Wiley-VCH Verlag, Weinheim, Germany (2009). doi: 10.1002/9783527628230.ch1
- P. Garidel, “Mid-FTIR-Microspectroscopy of stratum corneum single cells and stratum corneum tissue”, Phys. Chem. Chem. Phys. 4(22), 5671 (2002). doi: 10.1039/b207478h
- P. Garidel, “Insights in the biochemical composition of skin as investigated by micro infrared spectroscopic imaging”, Phys. Chem. Chem. Phys. 5(12), 2673 (2003). doi: 10.1039/b302749j
- S. Šašić, Y. Ozaki (Eds), Raman, Infrared and Near-Infrared Chemical Imaging. John Wiley & Sons, Inc. Hoboken, New Jersey, USA (2010). doi: 10.1002/9780470768150
- P. Garidel “Monitoring the penetration and distribution of topically applied formulations through the skin in relation to the skin protein/lipid morphological characteristics” Exogeneous Dermatology 3(3), 131 (2004). doi: 10.1159/000088011
- J.M. Chalmers and P.R. Griffiths (Eds), Handbook of Vibrational Spectroscopy, Volume 3: Sample Characterization and Spectral Data Processing. John Wiley & Sons Ltd, Chichester, UK (2002).
- P. Garidel and H. Schott, “Fourier-transform midinfrared spectroscopy for the analysis and screening of liquid protein formulations. Part 2: Detailed analysis and applications”, BioProcess Int. 4(6), 48 (2006).


