Antony N. Davies
SERC, Sustainable Environment Research Centre, Faculty of Computing, Engineering and Science, University of South Wales, UK
With so much coverage of Queen Elizabeth’s remarkable Platinum Jubilee celebrations, not only in the UK but around the world, I was driven to reflect on how our spectroscopic data handling and systems have changed during her long reign. This was rather like wandering around some of the heritage museums, which my family love so much and have visited often in the UK, Germany and the Netherlands. You see so much equipment which was familiar as an everyday tool in our house when growing up and now have to explain to the children exactly what each piece was used for!
I would like to take this opportunity to create a similar timeline. I hope with Ian’s permission that we can add to this timeline with contributions from any of you who have particular memories of systems that made a step-change in the way you worked with spectroscopic data.
In the following sections I have made a first attempt to identify “milestones” in the fields of spectroscopic data handling that have been made available to us during the reign of Queen Elizabeth II. I have also added various milestones and incarnations in the life of this journal. A disclaimer—there is no possible way in the space available that this list cannot fail to miss one of your favourite spectroscopic system developments over the last 70 years (!). So, we would very much like you to tell us about other “milestones” you would like to see put on the timeline using the form at https://www.spectroscopyeurope.com/form/td-column-timeline. Please include an image to go with the description. You can see what we have done for some of the entries below; let’s see what type of resource we can create together online!
1950s
- 1950: 15 August, Princess Anne the Princess Royal, second child and only daughter of Queen Elizabeth II born.
- 1951: Heinrich Kaiser gives a seminal lecture on the need for “modern analytical chemistry with physical, primarily spectroscopic methods”. Having worked at Carl Zeiss in Jena on spectroscopic instrumentation from 1934 before moving to the state material testing centre of North Rhine-Westphalia in Dortmund, where he took over the management of the spectrochemical laboratory.
- 1952: Kaiser is entrusted with the founding and management of the Institute for Spectrochemistry and Applied Spectroscopy (ISAS). He goes on to help start the Documentation of Molecular Spectroscopy (DMS) efforts collecting reference spectra and associated chemical structure information. Various collections subsequently published bilingually (English and German side by side) by Butterworths and Verlag Chemie in Weinheim.
- 1953: June 2 Queen Elizabeth II’s Coronation in Westminster Abbey.
If we go back to the decade immediately after the end of the second world war, spectroscopy as we know it was in its infancy. The need for high quality reference data to support the use and further development of these instrumental analysis techniques is recognised by a few influential scientists such as Heinrich Kaiser and the collection of reference quality data sets begins.
In what was essentially a pre-computing age, extremely clever manual systems were put in place or adapted to suit the needs of the analytical spectroscopist. One such was the DMS Card system shown in Figure 1.
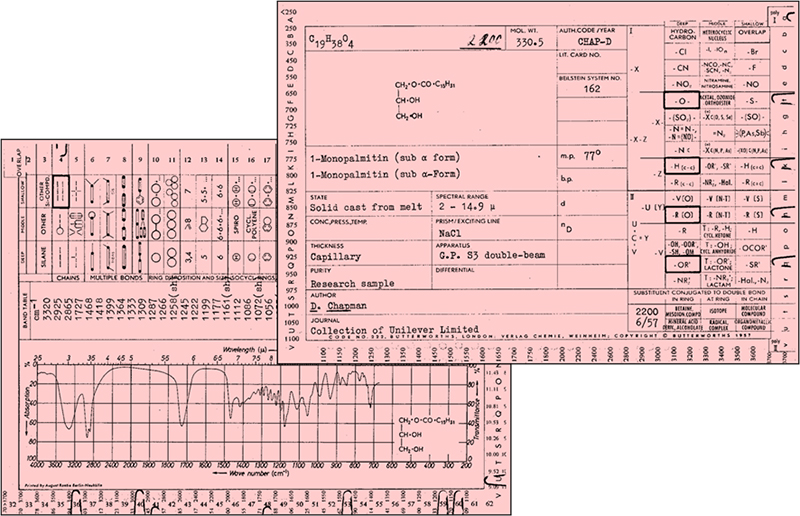
Figure 1. DMS cards, pink indicated organic compounds. Blue cards were for inorganic species.
- 1955: First printed version of the Sadtler Spectral Collections.
1960s
- 1960: 19 February Prince Andrew, Duke of York, third child of Queen Elizabeth II born.
- Mid. 1960s: Chemical structures added to Chemical Abstracts.
- 1964: 10 March—Prince Edward, Earl of Wessex, the Queen’s youngest son is born.
- 1965: Work begins on the DENDRAL (from “Dendritic Algorithm”) system artificial intelligence at Stanford University by Edward Feigenbaum, Bruce Buchanan, Joshua Lederberg and Carl Djerassi and their teams. Regarded as the first expert system, it was used to support organic chemists by using mass spectrometric data to suggest molecular structures.1
- 1969: Bruce Kowalski and co-worker publish works on the use of computers in the analysis of infrared spectra.2
- 1969: First edition of the Atlas of Mass Spectral Data (3 Volumes) edited by E. Stenhagen, S. Abrahamsson, University of Goteborg, Sweden and F.W. McLafferty, Cornell University, Ithaca, New York described at the time by a reviewer in the Journal of Chemical Education as “a massive compilation (over 6600 compounds)”. 39 sources contributed to this first edition with “the major part of the representing data from Dow and API. The tables are print outs of the computer based storage and retrieval system at the University of Goteborg.”3,4
1970s
- 1972: Protein Data Bank
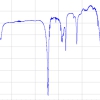
- 1974: Schrader and Meier publish the first edition of the Raman/IR Atlas of Organic Compounds.5 Again, here the quality of the analytical sample was paramount in producing top quality data collections. Enormous effort was spent by the technical staff producing this collection in not just buying/obtaining the various chemicals to be measured but in purifying them. The measurements were carried out just as carefully to avoid saturating the available equipment leading to peak distortions for example. The collection also put emphasis on measuring spectra typical to a compound class—and that is how the spectra are ordered in the Atlas allowing a quick comparison of spectroscopic difference between molecules with similar functional groups. With enormous foresight the data sets were also digitised onto paper tape rolls (Figure 2).
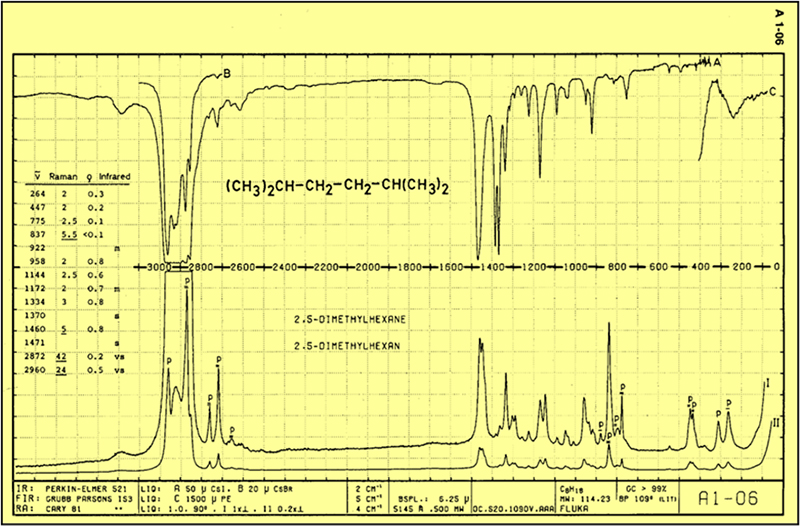
Figure 2. An example page from the Schrader–Meier Raman/IR Atlas of Organic Compounds.5
- 1975: ESN—European Spectroscopy News launched by Heyden; a predecessor magazine to Spectroscopy Europe and Spectroscopy World, starts publication.
- 1976: March 26, Queen Elizabeth sent her first email—probably the first head of state to do so.
- 1976: Milne & Heller publish the introduction to the MSDC/EPA/NIH Mass Spectral Search System, part of the NIH and EPA developed Chemical Information System (CIS). This includes multiple spectroscopic database search strategies.6
- 1977: Queen’s Silver Jubilee year, Her Majesty first flew in Concorde having followed its development for 11 years.
- 1978: Wolfgang Bremser publishes the HOSE code—a new substructure code which is a key component in NMR data handling for structure–spectra correlation.7
1980s
- 1980: First digital edition of the Sadtler Spectral Collection.
- 1981: 29 July—Charles, Prince of Wales marries Lady Diana Spencer.
1982: The Japanese SDBS Spectral Database System for Organic Compounds is first made available. This is a somewhat unique freely available collection of six different types of spectroscopic analyses and compounds. The database contains an electron impact mass spectra (EI-MS), Fourier transform infrared spectra (FT-IR), both 1H and 13C NMR spectra, laser Raman and electron spin resonance (ESR) spectra. The majority of the spectra were measured at the National Institute of Advanced Industrial Science and Technology (AIST) https://sdbs.db.aist.go.jp/sdbs/cgi-bin/cre_index.cgi
- 1982: Specialist spectroscopy publisher Heyden & Sons Ltd’s analytical titles acquired by John Wiley & Sons.
- 1982: 21 June—Queen Elizabeth’s grandchild, Prince William, Duke of Cambridge, born to Prince Charles and Princess Diana and, on 9 July, Queen Elizabeth awakes to find a stranger sitting on the edge of her bed, dripping blood from a cut hand.
- 1988: First JCAMP-DX spectroscopic data transfer standard developed between the academic, industrial and instrument vendor communities with the explicit aim of enabling the exchange of data between computer systems as a key enabler for the creation of reference spectroscopic databases.
- 1988: Responsibility for the NIST/EPA/NIH Mass Spectral Library passes to the NIST Mass Spectrometry Data Center. A different data quality ethos for collecting mass spectra with each spectrum being critically evaluated has meant that this collection has seemed to lag behind the other large collection of mass spectra.
- 1988: SMILES line notation published.8
- 1989: ESN—European Spectroscopy News acquired by Aster and becomes Spectroscopy International in Europe.
- 1989: Spectroscopy World begins publication in the UK.
1990s
- 1992: Spectroscopy International acquired by VCH and merges with Spectroscopy World to become Spectroscopy Europe.
- 1992: SpecInfo online goes live on STN international with 70,000 13C NMR, 17,000 infrared and 6000 NMR spectra of other nuclei (19F, 15N, 17O, 31P).9
- 1996: August sees the release of the NIST Chemistry Webbook—initially only with data from the NIST Standard Reference Database 19A: NIST Positive Ion Energetics, v. 2.0. For a recent review of all the reference data programmes run in the USA by NBS/NIST see Reference 10.
- 1996: 1–3 September—“Linking and Interpreting Spectra through Molecular Structures” conference includes the Warwick Challenge to the vendors present to demonstrate the import and export of data of the types that they can handle from the systems of the other vendors present. The conference passes a motion around the need for an analytical reference data archive.
- 1997: August—one year after the NIST Chemistry Webbook went live the first infrared and mass spectra are added to the resource.
- 1998: June—CAS celebrate 18 million substances registered with the chemical structure shown below

2000s
- 2000: July—CAS reaches 25 million registered entities registered in CAS.
- 2001: October—Dark Ages II: When the Digital Data Die by Bryan Bergeron published.
- 2001: the National Metrology Institute of Japan (NMIJ) under National Institute of Advanced Industrial Science and technology (AIST) takes over management and maintenance of the SDBS.
- 2002: Queen’s Golden Jubilee, 50 years. February—Seminar on Preserving the Record of Science, UNESCO, Paris.
- 2004: June saw the first conference in Analytical Laboratory Informatics, where vendors and scientists will actively work together to define innovative, sophisticated solutions for getting the most from our analytical data.
2000s The New Millenium
- 2013: 22 July—Prince George of Cambridge, born—the Queen’s great grandchild and 3rd in line to the throne.
- 2020: January sees the commencement of measures by European Governments to combat COVID-19.
- 2020: 2 April—John Wiley & Sons Inc. announces the acquisition of Bio-Rad Laboratories, Inc.’s Informatics products including the company’s spectroscopy software and spectral databases adding, for example, the KnowItAll software suite to Wiley’s Science Solutions.
- 2022: 2 June Queen Elizabeth II Platinum Jubilee.
A period that will surely be remembered not only for the Platinum Jubilee but also for the COVID-19 pandemic which impacted so many of us in terrible ways, often exposing deficiencies in our infrastructure and disaster recovery planning as many were forced to work from home for long periods where the infrastructure we rely on in normal times simply did not stretch. There is a useful resource published by the European Centre for Disease Prevention and Control which documents the timelines that different states adopted various measures to combat the disease.9 However, I believe this period will also be remembered for the innovation of our scientists and support staff as well as IT providers (think of the capacity and speed deficiencies of existing video meeting infrastructure at the start of the pandemic and the rise of Zoom calling!) who rose to the challenges and often changed roles and jobs to join the fight against the virus. As I write this many laboratories are still yet to return to pre-COVID tasking especially in the universities attached to medical schools. I salute all those involved in teaching spectroscopy for the multitude of innovative solutions they have found in the last couple of years to still provide a good education to our students in the most difficult of circumstances.
Wiley Registry™ of Mass Spectral Data, is now in its 12th Edition, with 817,290 spectra of 668,435 unique compounds and 785,061 chemical structures.
NIST/EPA/NIH EI-MS Library, 2020 release, 350,704 spectra of 306,643 compounds and 447,289 retention index values. Keeping up with instrumental developments the NIST Tandem Mass Spectral Library, 2020 release has 1.3 million spectra with 186,000 precursor ions from a variety of both high- and low-resolution fragmentations methods. Much of this data comes from human and plant metabolite studies, drugs and other bio-active compounds.
Let’s build on this resource…
As discussed at the top of the article please send in your own contributions to this list and see what we can generate together!
Stay Safe!
References
- E.A. Feigenbaum and R.W. Watson, “An initial problem statement for a machine induction research project”, Artificial Intelligence Project Memo No. 30, Computer Science Department, Stanford University, Stanford, CA (1965); R.K. Lindsay, B.G. Buchanan, E.A. Feigenbaum and J. Lederberg, “DENDRAL: a case study of the first expert system for scientific hypothesis formation”, Artificial Intell. 61, 209–261 (1993). https://doi.org/10.1016/0004-3702(93)90068-M
- B.R. Kowalski, P.C. Jurs, T.L. Isenhour and C.N. Reilley, “Computerized learning machines applied to chemical problems. Interpretation of infrared spectrometry data”, Anal. Chem. 41(14), 1945–1949 (1969). https://doi.org/10.1021/ac50159a026
- E. Stenhagen, S. Abrahamsson and F.W. McLafferty, Atlas of Mass Spectral Data; 3 Vols, Volume 1, Molecular Weight: 16.0313 to 142.0089; Volume 2, Molecular Weight: 142.0185 to 213.2456; Volume 3, Molecular Weight: 213.8629 to 702.7981. Interscience Publishers / John Wiley & Sons (1969). ISBN: 978-0470821107
- Book Review, J. Chem. Educ. 47(1), A64 (1970). https://doi.org/10.1021/ac50159a026
- B. Schrader and W.M. Meier, Raman/IR Atlas of Organic Compounds. Wiley-VCH Verlag GmbH, (1974). ISBN: 978-3527255399
- G.W.A. Milne and S.R. Heller, “The MSDC/NIH/EPA Mass Spectral Search System”, Am. Lab. 8, 43–49 (1976).
- W. Bremser, “Hose — a novel substructure code”, Anal. Chim. Acta 103(4), 355–365 (1978). https://doi.org/10.1016/S0003-2670(01)83100-7
- D. Weininger, “SMILES, a chemical language and information system. 1. Introduction to methodology and encoding rules”, J. Chem. Inf. Comput. Sci. 28(1), 31–36 (1988). https://doi.org/10.1021/ci00057a005
- A. Barth, “SpecInfo: An Integrated Spectroscopic Information System”, J. Chem. Inf. Comput. Sci. 33, 52–58 (1993). https://doi.org/10.1021/ci00011a009
- H.G. Semerjian and D.R. Burgess, Jr, “Data Programs at NBS/NIST: 1901–2021”, J. Phys. Chem. Ref. Data 51, 011501 (2022). https://doi.org/10.1063/5.0084230