Kim H. Esbensena and Brad Swarbrickb
aConsultant, independent researcher, Dr (h.c.), www.kheconsult.com. E-mail: [email protected]
bQBD Consultancy, www.qbd-consultancy.com
An alternative title for this column could have been: “What’s in an analytical datum?” Analytical results, and with them multivariate chemometric models, cannot be validated in isolation; analytical results have a pedigree, a history, which influences the quality of determination just as much as the technicalities of the analytical method itself—in fact, often more so. The relevant issue is representativity with respect to the primary target material, the lot. Analytical aliquots, or direct analytical signals, are the end-products of a compound “lot-to-analysis” pathway in which all preceding sampling/signal acquisition operations must be representative in order for analytical results (data in the chemometric world) to be valid renditions of the original lot material. The incurred sampling, sub-sampling, sample preparation and sample presentation errors, collectively constituting the Total Sampling Error (TSETOT), are typically 10–25+ times larger than the spectroscopic measurement errors alone (TAESPEC), i.e. TSETOT dominates the total measurement uncertainty budget. Focussing on analysis alone (TAESPEC) is, therefore, a breach of due diligence when seen from the point of view of the user of analytical results, which forms the basis for critical decision making in science, technology and industry. This column surveys the proper context for all critical steps before spectroscopic analysis and their impact on multivariate modelling of spectroscopic signals, irrespective of whether the TSETOT contributions are large, intermediate or small. All cases must be treated identically, including sensor-based solutions from the Process Analytical Technology (PAT) realm.
Introduction
The key issue of “sampling” is material and lot heterogeneity and how to counteract its adverse influence on sampling/signal acquisition, sub-sampling and sample preparation/presentation processes, all of which demonstrably take place before analysis. The Theory of Sampling (TOS) is the guiding framework for meta-analysis of all spectroscopic modalities. The TOS emphasises the Fundamental Sampling Principle (FSP), which states that all potential units from an original material must have an equal probability of being sampled in practice, and that samples are not altered in any way after sampling. Units can be particles, particle fragments or collections-of-units making up the practical sampling unit, termed increments. In the realm of quantitative spectroscopic analysis, compliance with the FSP is rather often a hidden elephant in the room; far from always properly acknowledged. In this light, many potential pitfalls exist regarding analysis in the lab as well as in Process Analytical Technology (PAT) applications, which must be avoided, lest unnecessary Total Sampling Error (TSETOT) will be produced. These errors will uncontrollably inflate the total Sampling-and-Measurement Uncertainty (SMU).
The present column focuses on the adverse influences that may crop up in the chemometric data modelling “on the other side” of production of analytical results, if the basic representativity demands from TOS are not heeded. The TOS needs only minimal presentation is this column.
Theory of Sampling, TOS
The FSP is the first of six Governing Principles (GP) and four Sampling Unit Operations (SUO), which must be honoured in order to guarantee sampling and analysis representativity. In previous Spectroscopy Europe columns, and within the chemometric and spectroscopic communities (the NIR realm in particular), the TOS has been presented extensively to any depth desired, as a unified, systematic framework for all principles and practical operations needed before analysis. While it is often argued that the analyst is only responsible for TAESPEC, someone else must then be responsible for controlling TSETOT. This is a most unfortunate division, however, that positively invites a serious sin-of-omission: who is really in charge of guaranteeing representativity of the analytical result, if/when most of the uncertainty is incurred outside the complacent four walls of the analytical laboratory? We here argue that it is better to view the “lot-to-analysis” pathway as a unified whole, as a common responsibility, which includes the quantitative analyst (of any spectral modality) as well as the data analyst, whether of chemometric or statistical inclination.
This column is a reasoned call for a holistic view of sampling, analysis and data modelling as an integrated whole. The relevant literature is numerous, and presents the minimum TOS competence necessary to be scientifically, technically and managerially responsible for guaranteeing relevant, meaningful and reliable analytical results—and for multivariate calibration models in all contexts, under all circumstances and for all types of materials that can be subjected to spectroscopic analysis. The comprehensive core reference list is all one needs.1–8
Reference 1 is a treatise answering the question: “WHY we need the Theory of Sampling (TOS)”. Reference 2 is the most recent presentation of the TOS, and Reference 3 is of particular relevance for quantitative spectroscopic analysis. Reference 4 is the de facto international standard on the general principles for representative sampling, often accompanied by Reference 5 for full coverage of the relationship between the TOS and Measurement Uncertainty (MU). Reference 6 introduces readers to the key process technology interplay between the TOS and PAT. Reference 7 is the most recent chemometric textbook, in which the critical pre-sampling realm is fully integrated, including its bearings on proper model validation (issues not covered by any other chemometric textbook). Reference 8 is a feature on the first order issues related to the application of on-line NIR to predict pharmaceutical powder composition, as an example of a study following the holistic call. This column takes up this scope and will in particular deal with the consequences of TOS non-compliance for the chemometric community, for which “data” are usually considered sacred entities—in the sense that nobody cares much about the pre-analytical realm: “Chemometricians analyse and model the data—basta!”
Only two TOS elements are needed for the present purpose:
Fundamental Sampling Principle (FSP): “TOS—the missing link in PAT”,6 amplified by Reference 8, explained the difference between physical extraction of samples (representative) or specimens (non-representative) relative to TOS-compliant spectral interaction with a stream of matter (representative “PAT process sampling”), and how this difference results from failure to comply with the FSP as applied to flowing streams of matter (all explained more fully below).
Sampling Bias: Failure to eliminate the complement of Incorrect Sampling Errors (ISE), wholly or partly, will unavoidably lead to a sampling bias, of unknown magnitude, which cannot be corrected for as presented in many of this column’s References. It will appear that within the PAT approach there are several major pitfalls if/when the pertinent TOS principles are not heeded (or are perhaps unknown).
In medias res
For the purpose of chemometric multivariate calibration/validation/prediction, we are at first interested in the relationship between:
“From-lot-to-aliquot” (sampling + analysis, i.e. traditional physical sampling), and
“From-lot-to-spectrum” (sampling via in- or on-line application of spectral analysis, PAT)
The traditional domain sampling + analysis needs only little comment. Seen from the point of view of the professional analytical laboratory, “samples” arrive in the lab, which is hired to produce the requested analytical results. Preferably representative samples, of course, but it is no mystery why many professional laboratories declare that the relevance, validity, quality and representativity status of primary samples is solely the responsibility of the client who supplies them, as this conveniently saves the day w.r.t. decisions made on the basis of the analytical results produced. Not surprisingly, we see in many cases that results supplied by Quality Control (QC) laboratories are understood as the absolute truth. And apparently with good reason, the analysis is representative of the sample delivered, but all issues about whether this means that it is representative of the entire lot from which it was extracted have disappeared. The demarcation between QC and production is never more pronounced than in this situation.
But it is also fair to say that such critical pre-analysis issues have begun to appear on the agenda, at least for some laboratories: “We know about the potential for gross sampling errors, that may very well jeopardise the objective of the client. Shall we tell him, or not?” There is (very) much more to discuss concerning the complex relationship between client, in this case production, and laboratory, and this was recently subject to an extensive analysis earlier in the Sampling Column.9,10
The in-, on-line realm (analysing while sampling) is of particular interest to the current column. Historically there has been a trend within PAC (Process Analytical Chemistry) and PAT to consider installing PAT sensors into a pipeline as synonymous with: “No sampling needed—spectra are acquired directly”, but this is a mistake of the highest order! Reference 6 was the first to deal intensively with what is a sampling duality, Figure 1.
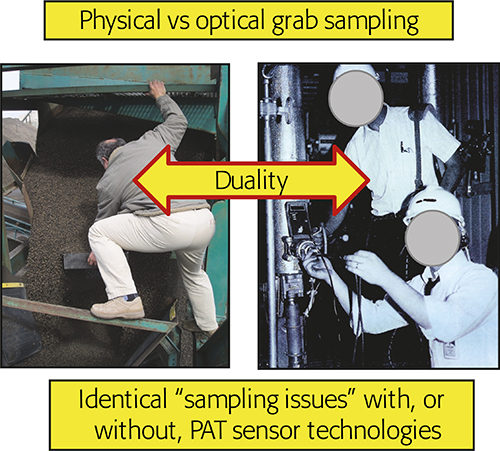
Figure 1. The fundamental sampling duality. Physical or optical grab sampling incur identical sampling error effects (ISE, CSE). Illustration copyright KHE Consulting, reproduced with permission.
This “no sampling” fallacy optimism is illustrated by showing how “direct” application of a PAT sensor does not eliminate the occurrence of massive ISE, Figures 2 and 3.
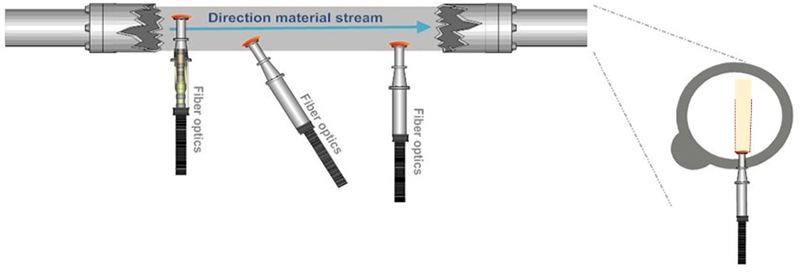
Figure 2. The “PAT sensor application solves all sampling issues” fallacy, which follows because PAT sensors are not “seeing” a volume corresponding to a full cross-sectional slice of a moving stream of matter, see also Figure 3. Illustration copyright KHE Consulting and Martin Lischka, reproduced with permission.
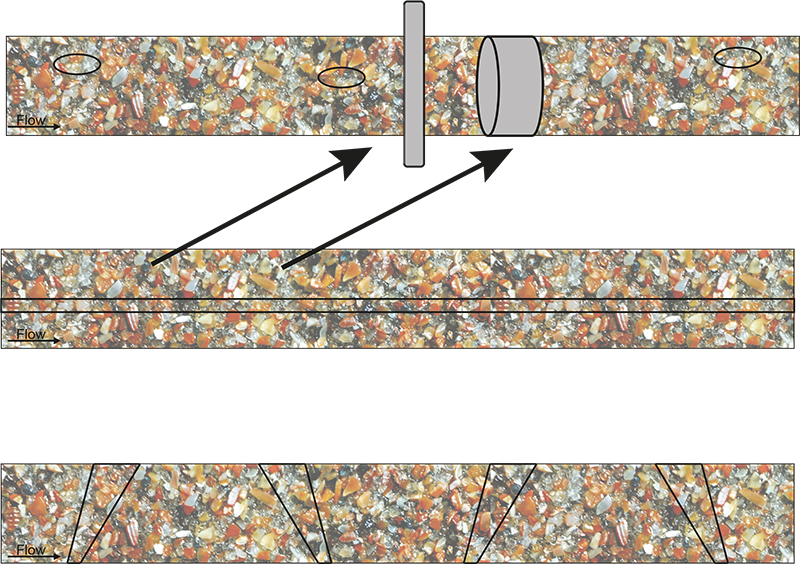
Figure 3. Massive ISE as a result of non-compliance with TOS’ principles. This figure can alternatively be understood as looking down on the top of moving conveyor belts, or as representing a longitudinal section of a ducted flow in a pipeline. “TOS-correct” delineation and extraction of cross-sectional increments, or sliced stream volumes, are shown in grey in the top panel. All other indicated increments give rise to a significant sampling bias. Illustration copyright KHE Consulting and Martin Lischka, reproduced with permission.
It seems difficult to understand why this fallacy has originated, and why it has been propagated during at least two decades in the PAT realm. The strict truth is that only a full slice of the stream of matter qualifies as the proper volume/mass support for a representative increment/signal.a
aThe present column presents the strict demands for representative increment extraction/signal acquisition. The reader will realise that often there are severe practical difficulties involved when trying to comply herewith, for example that the effective NIR path length is ~30 mm while the effective duct diameter can be larger (much larger), say 100 mm or more? “Smartly” implemented reflectance probes may go a certain way to remedy this shortfall, but are essentially bracketed by the same path length maximum. A bypass duct will quickly become of significant interest a.o. The issues raised in the present column will be addressed in the form of solutions in the next Columns in this series.
The above leads directly to a fundamental distinction in this context between:
- A sample cell (sample: noun) and,
- A sampling cell… (sampling: verb)
Upon reflection, it is the act of simultaneous sampling-and-analysis that distinguishes the sampling cell—and which in a sense may appear as making (physical) sampling superfluous. But this latter is critically dependent on representative sampling, a proviso of overwhelming importance. If sampling is not representative, all manner of unknown, inconstant sampling bias will still be part of the equation, totally destroying the “no sampling” claim. On the other hand, if/when a sampling-and-analysis cell complies with TOS’ demand for representativity, conditions are right for reaping the powerful advantages of the PAT revolution, but only then. Reference 6 treats these issues in detail.
A cursory survey of relevant industrial process technology and dedicated PAT literature from the last 10 years or so does not impress. Unwitting neglect of the “full slice” dictum can be found in abundance (but there are moments of satisfaction as well). The mission here is not to identify which are which, but only to direct attention to the critical need for a certain minimum TOS competence in the PAT realm.
Proper application of TOS’ relevant GP and SUO in the pre-analysis realm is a mandatory requirement in order to guarantee that samples, or the spectral acquisitions from matter streams, can be proven to be representative. Failure to live up to this demand will result in compromised analytical samples/signals with which to begin a subsequent chemometric data analysis or modelling.
As a prominent contemporary example, consider the rapidly expanding case of continuous manufacturing (CM) in the pharmaceutical industry sector. Figure 5 shows the many locations in the CM pathway where NIR spectroscopic characterisation finds very good use. Figure 5 also shows where one would easily lose one’s way were not a modicum of TOS competence involved in the design, implementation, validation and operation phases of starting up using this manufacturing approach.
While it may often seem to be relatively easy to obtain “direct spectral data” via inserted PAT sensors, as indicated in Figures 4 and 5 (X-data in regression), these are nevertheless critically dependent on whether the ISE issues outlined above have been successfully eliminated, or not. Failure to comply with this requirement is the by far the most often met with deficiency within a trigger-happy chemometric community; the literature is full of illustrative examples, but we shall here refrain from identifying journals, papers, authors—the task here is to sound a warning against continuing to be unaware (or to wilfully neglect) the critical support volume dictum. Fortunately, a lot of work has been performed by the pioneers of CM systems to address such sampling issues and the fact is that a CM system essentially reduces a traditional 3-D sampling plan (traditional approach to manufacturing) with a 1-D sampling situation. This is the optimal, TOS-correct understanding from which to begin to look for solutions to the sampling issues warned about.
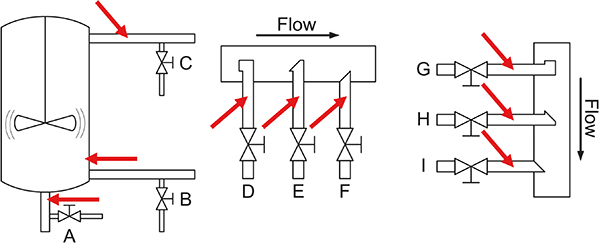
Figure 4. Overview of the many possibilities for installing “sample extraction valves” and “PAT sensors” in traditional process industry. Note that all configurations shown here will lead to incorrect, i.e. biased samples or spectral signals as regards representativity because their support volumes do not correspond to full stream slices. Reference 6 treats these process sampling issues in depth w.r.t. solutions to the problems emphasised. Illustration copyright KHE Consulting, reproduced with permission.
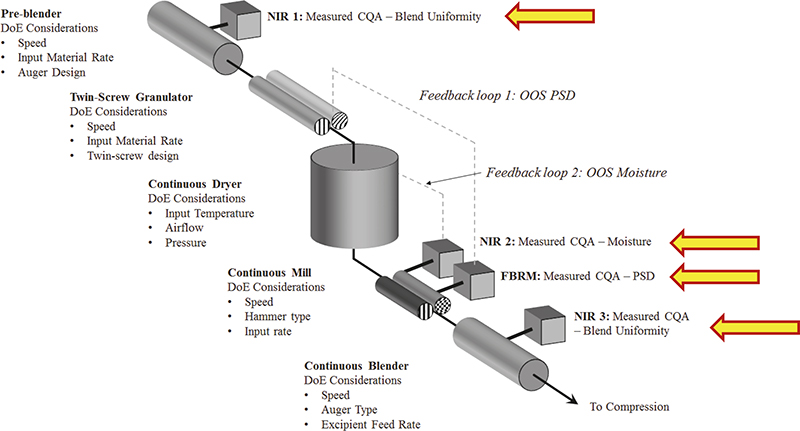
Figure 5. Four process analytical locations involved in CM, based on in-line sampling-and-NIR spectroscopic prediction of pharmaceutical API composition, moisture, PSD and blend uniformity. In addition to ISE associated with incorrect support volumes, which will affect the quality of spectral X-data in multivariate calibration, there is also the equally important issue of the quality of corresponding Y-data, for which representative reference samples must be obtained. But where exactly, and how, should these be extracted? This is a classical sample extraction issue, far from always properly acknowledged and far less satisfactorily solved, primarily because TOS continues to be a partly (largely) little acknowledged critical success factor in process technology, spectroscopy and chemometrics. Illustration copyright QbD Consultancy, reproduced with permission.
In addition, in order to perform proper multivariate calibrations for one or more y-variables, it is necessary to extract relevant, valid and representative reference samples (Y-data in regression). Indeed, this also applies for proper test set samples to be used for validation of the desired multivariate calibration models with which to carry out on-line prediction of blend uniformities (real-time compositional variation), moisture, PSD… .7 A documented facility for representative acquisition of both sensor signals (X-spectra) and reference samples (reference data) must be present, or multivariate calibration/validation models for prediction will forever continue to suffer “impossible to reduce” prediction errors etc. These issues are often described in suspiciously murky fashions in the literature; one is tempted to interpret this as if authors actually do understand the fundamental ISE issue here, but are at a complete loss to come up with solutions that work. In fact, “sweeping the problem under the carpet” has led to many process failure investigations and “incomprehensible results”, which in reality is fighting fires that simply are just not there in the first place.
Many skills needed
This column has the purpose to introduce all elements from the diverse disciplines of i) the TOS, ii) process engineering, iii) spectroscopic analysis, iv) sensor technology, v) PAT and vi) chemometric data analysis. All need to acknowledge that analytical results pertaining to heterogeneous materials and systems have a history in which some degree of sampling (primary, secondary, tertiaryb) is always present.c For this fundamental reason “What’s in an analytical datum?” will always include a significant complement of error effects and uncertainties stemming from this pre-analysis realm (smaller or larger, but never absent). The point is that this state-of-affairs must be acknowledged by analysts and data analysts; this point has been forcefully argued in Reference 5. It is no longer appropriate to pass the responsibility onto someone else. If PAT is going to be implemented successfully by an organisation, all involved in quality, production, regulatory affairs, as well as management, must be on the same page.
bi.e. sub-sampling/splitting in several stages; these are bona fide sampling processes in their own right.
cExceptions, for example uniform materials, de Beer dilutions etc. cannot establish a basis for solving the infinitely more complex issues surrounding the kind of significantly heterogeneous materials treated here.
Chemometric data modelling
“Compromised samples or signals”—in what sense? Compromised, because extraction of physical samples or acquisition of spectral signals will be associated with a significant sampling bias. The nature of a sampling bias is that it cannot be corrected for by any means, data analytical or statistical, as distinct from an analytical bias, which can be subjected to a statistical bias-correction. This, perhaps surprising, distinction is treated in full in References 2–7.
The effect of this on chemometric data analysis and modelling is like the proverbial elephant in the room, generally unnoticed. Put simply, no manner of data analysis, data modelling etc. from the chemometric and the statistical domains will be able to correct for a sampling bias; see References 6 and 7 for a full argument for why this is not possible; also see Figure 6.
What is the specific effect on multivariate data analysis, modelling and calibration?
First: There will be an inflated total MU associated with every analytical result, very often significantly larger than the specific analytical error itself (which may occasionally also be significant of course, but only as a result of an analytical method not in proper control; such an issue will eventually be brought under control, GLP a.o.).
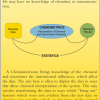
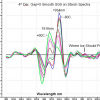
Second: There will always be a component of the multivariate data errors so effectively screened away by the powerful bi-linear data modelling approaches in chemometrics that must be taken into account when appropriate. Figure 7 shows a principal illustration of chemometric decomposition of multivariate data into systematic data structures (principal- and PLS-components) and decoupled multivariate data errors (es in chemometric parlance).
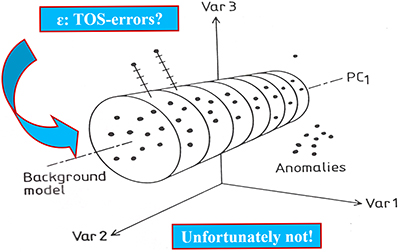
Figure 7. Chemometric bi-linear data model of pervasive data structures, PCA or PLS-components (schematic sketch). The multivariate data model errors (es) are often optimistically thought of as “TOS-errors” (TSETOT + TAE), but they are not, see text for clarification.
A tacit understanding within chemometrics has been that bi-linear errors (es) would turn out to include TOS-errors stemming from sampling deficiencies, in which case it would actually be possible to correct for ISE after all. Indeed, multivariate data analysis would then appear on the scientific scene with an unbelievable power, not even known or foreseen in the genesis and development of chemometrics. Alas, this is not so!
The effect of sampling bias inflation of the total sampling + analysis uncertainty level is such that both data analytical components as well as their complementary errors (es) are affected by the inconstant bias effect. Because TOS-errors are expressed for single variables in turn, the bias will affect each individual variable differently. The sum-effect of an unresolved sampling bias is such that TSETOT will vary every time a new analytical determination is attempted on a new sample. This means that every new sample added to an already existing data matrix, think of a training data set, will each add its own, varying contribution to the total data variance—and thus also to the total data set covariance. Thus, both components and errors will be affected. These issues are described in more detail in Reference 7.
For completion, the complement of Correct Sampling Errors (CSE) will also affect each variable individually, after elimination or maximal reduction of ISE.
Consequences for chemometrics
Because there are many influential agents involved for each sample extracted, or for each signal acquired by a PAT instrument, it may easily be an unhelpful simplification to understand all “data” as but identical realisations of variables, each with a systematic information content to which is added a stochastic error complement. Within chemometrics the former can be successfully modelled by data analytical “components” and the latter can be conveniently identified, quantified—and then discharged, so this would be “all one needs to know” if data are always, ipso facto, representative and reliable. This is not so, however!
This column has argued that the background for each individual datum, and for analytical data collected as matrices must be appreciated in a more fully developed setting in which significant parts of the traditional “measurement error” also contain contributions, often large contributions, related to the specific history of each sample, aliquot or spectral signal support. The data analyst must be mindful of this intricate relationship, lest glib, simplistic interpretations of “measurement error” will run a grave risk of not reflecting the more complex reality.
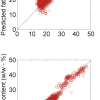
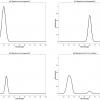
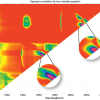
The archetypal manifestation of these relationships is shown in Figure 8, which highlights the fact that any chemometric prediction model falling short of sufficient performance, for example as evidenced by a “too high” RMSEPvalidation, can only be improved upon by caring about the TSE incurred for all data, critically based on the full understanding that the error complement is overwhelmingly made up of contributions by the TSETOT.
Thus, it is not a guaranteed successful strategy to care only for the “data” as such, with an aim of optimal data analytical modelling systematics (chemometric components), perhaps acknowledging a minor measure of accidental analytical error in addition. This will, therefore, not include the major determinants stemming from unrecognised, or deliberately overlooked, sampling errors and their incurred uncertainties. Interpretation of standard regression-prediction figures-of-merit, e.g. RMSEPvalidation must be based on a modicum of TOS knowledge and competence in order to be able to improve on unsatisfactorily “imprecise” prediction performance statistics. In our collective experience many data analysts skip straight to the R2 value of a fitted regression line as if this was some form of magical truth statistic, but it only relates to model fitting.
Here is the most relevant criterion for evaluation: for an optimal bi-linear model, the RMSEP errors should be statistically comparable to the reference chemistry errors and this situation should be achieved with a relatively small number of model components. The implicit modelling of random artefacts in the spectral data to overcome material heterogeneity and non-representative sampling only relates to the miniscule test volumes involved. If a large number of model components is required to achieve your error target (if this is even at all possible), this is only modelling a mirage. If a chemometric model cannot be brought below your a priori established RMSEP error threshold, it is telling you there is a fundamental problem outside of the analytical realm.
This is true information—for which no amount of calling for “more samples”, more spectra (to average), more model components will ever help. The unpleasant situation, Figure 8, simply means that you must focus on improving your sampling practices. TOS to the fore!
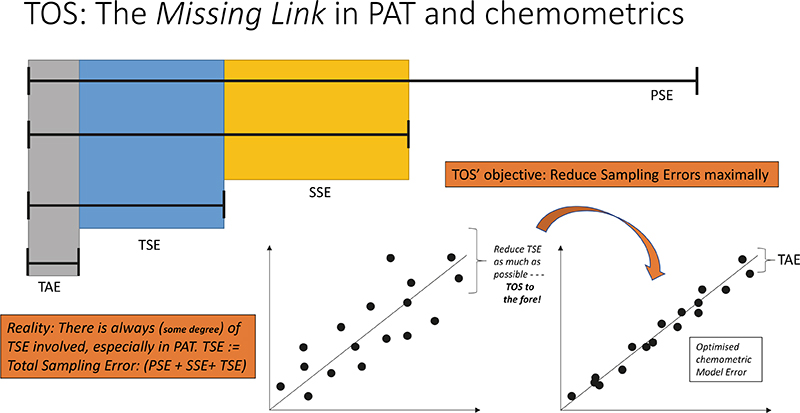
Figure 8. Theory of Sampling (TOS)—the missing link in PAT and chemometrics. Key effects shown here concern decoupling of TSETOT into contributions from primary sampling errors (PSE), secondary and tertiary sampling (SSE, TSE) and the analytical error s.s. (TAE). The lower panels illustrate how an unsatisfactory RMSEPVALIDATION of a multivariate prediction model manifests itself on a “predicted vs reference” plot. The TOS is the only approach that outlines solutions that lead to reduction of TSETOT.
Conclusions
The one sure way not to be able to reduce the uncertainty elements behind data analytical models that does not comply with desired prediction performance goals, is the traditional call for more data (an approach very often cited in the literature and observed in practice). More data, meaning more samples for analysis, will always display the same TSETOT characteristics as the samples already included in the contemporary training data set, see Reference 7. The number of times this futile call has been heard in practice is overwhelming, and is usually preached to those with little experience in the PAT/chemometrics fields in order to avoid the more difficult problems revealed here. Focussing on the root cause, i.e. why the samples and their analytical result do not match with reality is a simple sampling issue, however, and must be treated as such.
In fact, most of the initial efforts in PAT implementation and data modelling should be focused on improving and optimising sampling—way before analysis and data analysis. As the saying goes: “if the data already contain the information, then the chemometrics will succeed”. However, if the data are swamped by sampling noise, even applying implicit or explicit “correction functions” will still not improve the accuracy of the analytical results, because this inaccuracy can never be modelled away.
Chemometrics is not a black box, “push button” approach where the modelling will automatically do the rest! Automated chemometrics routines in software packages should be outlawed and never used! How dare a vendor provide software to replace the many years of competent chemometricians’ experience around the world by reducing our collective practice down to a single automated routine! And when this approach does not work, the same vendors tell their clients to collect “more samples” to avoid the issue at hand. Chemometrics is not a supermarket of models, but a scientific expertise area where all sources of variation must be understood such that the model is interpretable and validateable.
Barring trivial, accidental TAE mishaps (which are always special cases, only of interest to themselves), the only way to reduce unsatisfactory (TSE + TAE) levels is by reducing TSETOT. Thus, the only way to be able reduce the “troublesome”, apparently incompressible uncertainty contributions behind unsatisfactory multivariate data analytical models, Figure 8, is to master the necessary basics of the TOS.
Chemometrians are not exempt from these scientific insights. There is no longer an excuse to hide behind “I don’t need to learn chemometrics, the superior software will sort it out for me”. Like with CGMPs for the 21st Century, we also need to take a 21st Century approach to the full sampling–analysis–data analysis pathway, otherwise we will be travelling the same merry go round, always chasing our own tail and never progressing.
The promise
We shall address the many issues pointed to in this column from the point of view of solutions in the next columns in this series.
References
- K.H. Esbensen and C. Wagner, “Why we need the Theory of Sampling”, The Analytical Scientist 21(October), 30–38 (2014).
- R.C.A. Minnitt and K.H. Esbensen, “Pierre Gy’s development of the Theory of Sampling: a retrospective summary with a didactic tutorial on quantitative sampling of one-dimensional lots”, TOS Forum 7, 7–19 (2017). https://doi.org/10.1255/tosf.96
- K.H. Esbensen, R.J. Romañach and A.D. Román-Ospino, “Theory of Sampling (TOS): a necessary and sufficient guarantee for reliable multivariate data analysis in pharmaceutical manufacturing”, in Multivariate Analysis in the Pharmaceutical Industry, Ed by A.P. Ferreira, J.C. Menezes and M. Tobyn. Academic Press, Ch. 4, pp. 53–91 (2018). https://doi.org/10.1016/B978-0-12-811065-2.00005-9
- DS 3077, Representative sampling—Horizontal Standard. Danish Standards (2013). http://www.ds.dk
- K.H. Esbensen and C. Wagner, “Theory of Sampling (TOS) versus Measurement Uncertainty (MU)—a call for integration”, Trends Anal. Chem. (TrAC) 57, 93–106 (2014). https://doi.org/10.1016/j.trac.2014.02.007
- K.H. Esbensen and P. Mortensen, “Process Sampling (Theory of Sampling, TOS) – the Missing Link in Process Analytical Technology (PAT)”, in Process Analytical Technology, 2nd Edn, Ed by K.A. Bakeev. Wiley, pp. 37–80 (2010). https://doi.org/10.1002/9780470689592.ch3
- K.H. Esbensen and B. Swarbrick, Multivariate Date Analysis – An introduction to Multivariate Data Analysis, Process Analytical Technology and Quality by Design. CAMO (2018).
- R.J. Romañach, R. Méndez and K.H. Esbensen, “Application of Theory of Sampling principles for real-time monitoring of pharmaceutical powder blends by near infrared spectroscopy”, Spectrosc. Europe 31(5), 22–27 (2019). https://www.spectroscopyeurope.com/sampling/application-theory-sampling-principles-real-time-monitoring-pharmaceutical-powder-blends
- K.H. Esbensen, “A tale of two laboratories I: the challenge”, Spectrosc. Europe 30(5), 23–28 (2018). https://www.spectroscopyeurope.com/sampling/tale-two-laboratories-i-challenge
- K.H. Esbensen, “A tale of two laboratories II: resolution”, Spectrosc. Europe 30(6), 23–28 (2018). https://www.spectroscopyeurope.com/sampling/tale-two-laboratories-ii-resolution

The authors
Kim H. Esbensen, Ph.D, Dr. (hon), has been research professor in geoscience data analysis and sampling at three universities (1990–2015), after which he moved to be an independent researcher and consultant: www.kheconsult.com. He is a member of several scientific societies and has published over 260 peer-reviewed papers. Together with Brad Swarbrick, he authored a widely used textbook in Multivariate Data Analysis, published in 2018 (http://bit.ly/chemometrics). He is a co-founder of the International Pierre Gy Sampling Association www.intsamp.org and is editor of the magazine TOS forum, impopen.com/tos-forum, and of this Sampling Column.
Brad Swarbrick is owner of Quality by Design Consultancy (www.qbd-consultancy.com) and Co-founder of KAX Group (www.kaxgrp.com). He is a world recognised expert in the application of chemometrics and design of experiment methodology to Process Analytical Technology (PAT) applications in Quality by Design (QbD) environments.