K. Hinrichsa and K. J. Eichhornb
aISAS–Institute for Analytical Sciences, Department Berlin, Albert-Einstein-Str. 9, 12489 Berlin, Germany
bLeibniz Institute of Polymer Research Dresden, Hohe Str. 6, 01069 Dresden, Germany
Introduction
Thin polymer layers on solid substrates are of high technological importance due to their increasing potential for applications in electronics, sensors, nanotechnology and biotechnology. Appropriate characterisation methods are necessary for the design and analysis of devices made using such materials. This review article focuses upon presenting the many analytical possibilities for quantitative evaluation of the optical constants and thickness of polymer layers by combined application of spectroscopic ellipsometry (SE) in the visible (vis) and infrared (IR) spectral range.
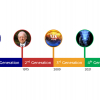
In general, ellipsometry1 is the method of choice for the correct determination of optical constants; it provides polarisation degree and phase as well as the amplitude information of the optical response. These quantities may be derived within one experiment and thereby optical simulations and quantitative interpretation are improved for many applications. For many polymers, no characteristic absorption bands are observed in the vis spectral range. Therefore, extension of the spectral range to the IR and ultraviolet (UV) regions is desirable because characteristic vibrational or electronic absorptions are available within these ranges (Figure 1). However, it must be considered that many polymers might be degraded by intense UV irradiation.
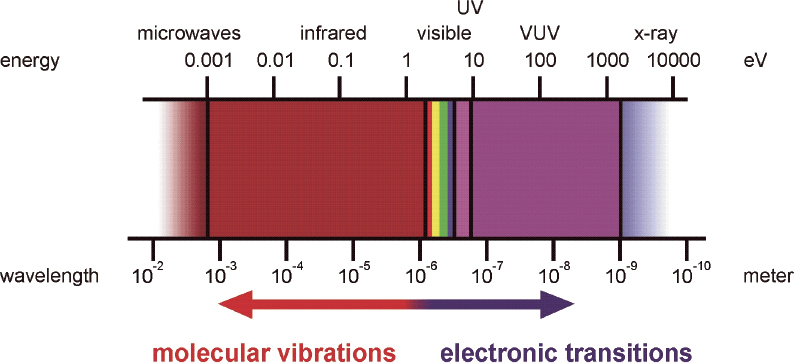
Figure 1. Spectral range for ellipsometry and typical ranges for vibrational and electronic excitations.
Vis ellipsometry is a standard method for determination of the optical constants, roughness and film thickness. Bare polymer surfaces, single polymer films on reflecting solid substrates, interphases in bilayers, adsorbed mono- and multilayers on polymer films can be analysed in vacuum, in different atmospheres or under liquids as well. Layers may be formed using spin- and dip-coating, grafting to or grafting from procedures, self-assembly and Langmuir–Blodgett techniques. Kinetics of layer formation, swelling and deswelling and adsorption and desorption processes can all be studied in situ. Recent results have been reported for polyelectrolytes, thermo responsive hydrogels and proteins. Only few applications are known for detailed spectroscopic ellipsometry studies, including electronic transitions of organic films. One reason might be that measurements have to be performed in the UV or vacuum ultraviolet (VUV) range, since very few electronic transitions occur in the vis. On the other hand, ellipsometry in the IR spectral range has become established over recent years because of the large amount of valuable information that can be derived from the analysis of characteristic vibrational bands. As with vis ellipsometry, optical constants and structural properties of thin films and layered systems can reliably be derived using IR ellipsometric measurements by strict correlation with optical theory. The extensive analytical potential of IR ellipsometry is based on:
- a contactless and non-invasive measurement,
- monolayer sensitivity,
- identification of chemical bonds of the film and interface by characteristic vibrational absorption bands, and
- optical modelling with respect to molecular orientations, composition, miscibility, inter-diffusion and interactions at interfaces, single films and in multilayers.
Ellipsometric method
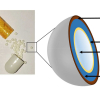
Upon reflection at a plane surface, linearly polarised radiation generally becomes elliptically polarised (Figure 2). The measured ellipsometric parameters, tanY (relative amplitude ratio) and D (relative phase shift) are related to the complex reflection coefficients rp and rs, which correspond to the p- and s-polarised electric field components, respectively. They are complex functions of the angle of incidence F0, the wavelength l, the optical constants of the substrate (Ns), the ambient medium (n0) and the layers (nj, kj), and of the layer thicknesses (dj):
\[\tan \Psi \times {{\rm{e}}^{i\Delta }} = \frac{{{r_p}}}{{{r_s}}} = F({\Phi _0},\,\lambda ,\,{N_s},\,{n_0},\,{n_j},\,{k_j},\,{d_j})\]
j = 0, 1, 2… (number of layers)
N = n + ik (N: complex refractive index; n: refractive index; i: imaginary unit; k: absorption index). The optical constants can also be expressed as the complex dielectric function e, with e = e1 + ie2 and N = e1⁄2. The fit of the parameters of an optical model to the measured values of tanΨ and Δ provides the layer thickness and optical constants of layered substrates. Strictly speaking, the fundamental equations of ellipsometry are only valid for systems consisting of homogeneous phases with smooth and parallel interfaces. Nevertheless surface roughness, graded or heterogeneous composition and anisotropy can be modelled in some cases.
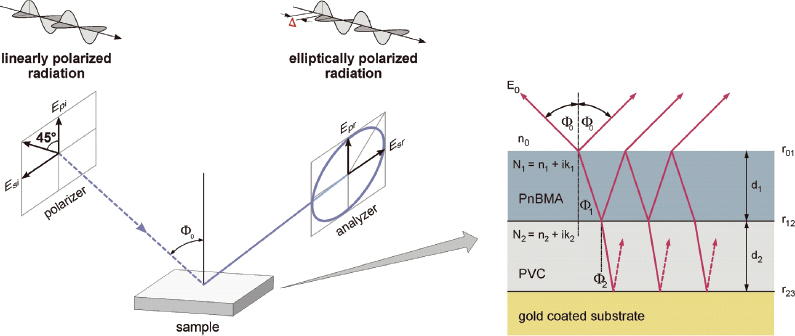
Figure 2. Principle of ellipsometry is shown on the left side. On the right: a typical optical model as used for evaluation of ellipsometric spectra of a polymeric double layer is presented. Optical constants of single compounds such as, for example, PVC and PnBMA, are determined by best-fit simulations in an isotropic single layer model of ellipsometric spectra from films of the respective polymer.
Variable Angle Spectroscopic Ellipsometry (VASE) in the visible spectral range (420–763 nm) was carried out using a rotating analyser type 44-wavelength ellipsometer M-44 (J.A. Woollam Co., Inc., Lincoln, NE, USA); details can be found in Reference 4. The mid-infrared ellipsometer (2.5–25 µm) was attached externally to a Bruker Fourier Transform interferometer (Bruker Optics, Ettlingen, Germany). Details about the measurement and IR ellipsometry set-up are described elsewhere.10
Isotropic films
Thickness d and refractive index n of single films of poly(vinyl chloride) (PVC) and poly(n-butyl methacrylate) (PnBMA) (Figure 3) on gold were determined by fitting the measured vis ellipsometric Δ and tanΨ spectra using a two-parameter Cauchy function for n: n(l) = An + Bn/l2, with k = 0. For interpretation, the experimental spectra were simulated in an optical single layer model. Note, that only for an isotropic sample can the optical constants be determined directly from the measured ellipsometric spectra provided that the surface contribution may be negelected.11 The frequency independent part (An) was taken as the high frequency refractive index in the simulation of the infrared ellipsometry results [n∞ = 1.483 (PnBMA) and n∞ = 1.546 (PVC)]. For simulations of IR spectra, vibrational bands are often included as harmonic oscillators.9 Typical results for the determined optical constants of isotropic PnBMA and PVC films are shown in Figure 3. Because no electronic absorption exists in the vis spectral range (800–400 nm) the determined dispersion curves of optical constants are “flat” and not structured. In contrast, the presented IR spectral range (4000–18,000 nm; 2500 cm–1 to 556 cm–1) shows a high spectral contrast due to bands of characteristic vibrational absorptions.
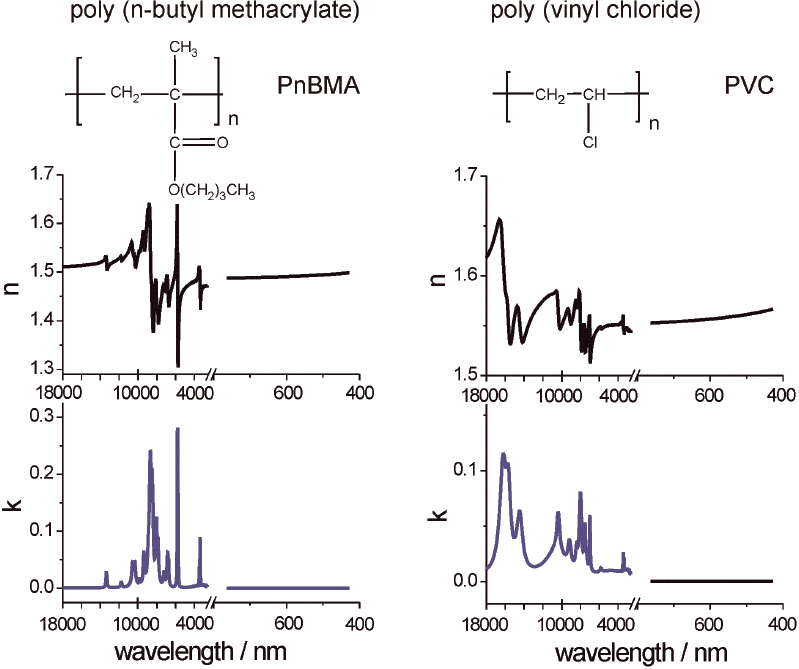
Figure 3. Optical constants of poly(n-butyl methacrylate) (PnBMA) and poly(vinyl chloride) (PVC) from 18,000 nm to 400 nm. The constants were revealed by a best fit of the ellipsometric spectra of a thick single layer on a gold-coated glass substrate (PnBMA: d = 98.5 nm ± 0.5 nm and n∞ = 1.483, and PVC: d= 104.1 nm ± 0.5 nm and n∞ = 1.546; n∞ values are taken from vis ellipsometry).
Such optical constants can now also be used for forward calculation of more complex systems, as, for example, a PnBMA/PVC double layer (Figure 2). Then important properties, such as the composition, miscibility, interdiffusion and interactions at interfaces and in thin films can be evaluated.7,12–14 However, the optical constants of a mixed phase might be different to those of a simple mixture of optical constants of the pure materials. In particular for PnBMA/PVC, a manifestation of hydrogen-bonding-type intermolecular interactions between the two polymers was identified. Moreover, conformational changes were indicated by characteristic changes of absorption bands of PnBMA associated with CO and CC stretching modes of the ester groups in the 1300–1100 cm–1 range. Increasing annealing time leads to a better mixing at the interface and an increase in the fraction of hydrogen-bonded carbonyl groups.14 Having the optical constants of the pure and mixed material, the thickness of the mixed phase at intermediate steps of mixing was determined from optical simulations in a multilayer model.15
Anisotropic films
Anisotropic optical constants of a spin-coated aromatic polyimide [poly(biphenyl dianhydride-p-phenylenediamine)] (PI2611-DuPont) were determined by a best fit of the ellipsometric spectra of a 1.81 µm thick film on silicon. n∞xy (n∞z) was chosen to be at 1.76 (1.56) in the IR, whereas a higher value of 1.92 (1.69) was found at l = 500 nm. In both cases an anisotropy Dn of about 0.2 was obtained. Details about the simulations of the vis ellipsometric spectra can be found in Reference 16; determination of a complete set of anisotropic optical constants of a polymer film has been performed and are given in Reference 9. The uniaxial IR optical constants of the polyimide film were deduced from a cooperative study using IR-SE, reflection absorption infrared spectroscopy (RAIRS) and IR transmission spectroscopy, which were measured in the same optical set-up. The determined refractive index n and the absorption index k, parallel (x, y) and perpendicular (z) to the sample’s surface plane are presented in Figure 4. The observed anisotropy can be interpreted by a preferential molecular orientation of the aromatic imide segments lying almost parallel to the surface plane.
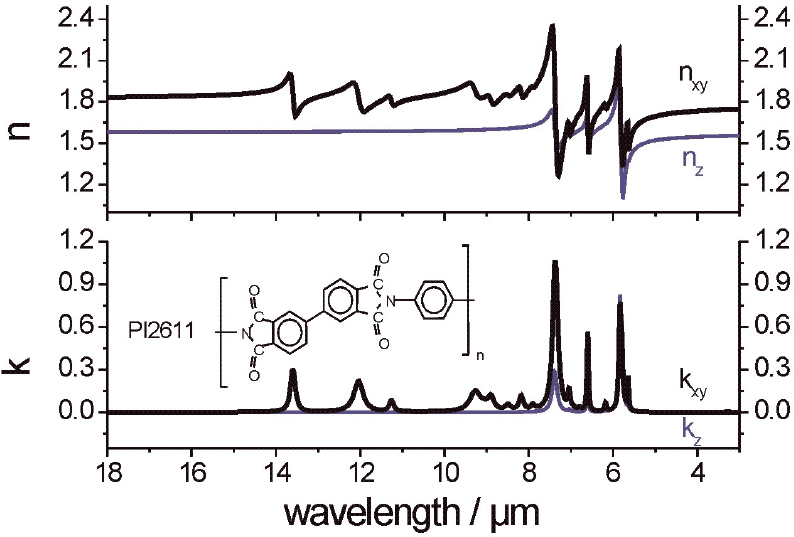
Figure 4. Anisotropic optical constants of PI2611 polyimide film from 18 µm to 3 µm. The constants were revealed by a best fit of the ellipsometric spectra of a 1.81 µm thick PI2611 film on silicon. n∞xy (n∞z ) was chosen to be at 1.76 (1.56), which show nearly the same anisotropy (∆n ~ 0.2) as the values 1.92 (1.69) found at λ = 500 nm. The shown curves are adapted from the results in Reference 9.
Conclusion
In conclusion, the combined application of IR and vis ellipsometry has been demonstrated to be a powerful tool for quantitative analysis of thin isotropic and anisotropic polymer layers. The determined optical constants of the single materials are important quantities for the quantitative interpretation of optical spectra and can, moreover, be used as input for interpretation of spectra of thin films (from µm down to a few nm thickness)12–14 and measurements taken by other techniques.8
Acknowledgements
The authors like to thank Professor N. Esser, Dr A. Röseler, Dr E.H. Korte, Dr K. Sahre and Dr M. Gensch for many valuable discussions. We also thank Ms I. Fischer and Mr R. Schulze for technical assistance. Additionally we thank Sentech Instruments GmbH (Berlin, Germany) for cooperation at the synchrotron ellipsometer at BESSY. The financial support by the Senatsverwaltung für Wissenschaft, Forschung und Kultur des Landes Berlin and by the Bundesministerium für Bildung und Forschung is gratefully acknowledged.
References
- A.G. Tompkins and E.A. Irene (Eds), Handbook of Ellipsometry. William Andrew Publishing—Springer (2005).
- S. Schwarz, K.-J. Eichhorn, E. Wischerhoff and A. Laschewsky, Colloid. Surface. A 159, 491 (1999).
- J. Hegewald, T. Schmidt, K.-J. Eichhorn, K. Kretschmer, D. Kuckling and K.-F. Arndt, Langmuir 22, 5152 (2006).
- C. Werner, K.-J. Eichhorn, G. Grundke, F. Simon, W. Grählert and H.-J. Jacobasch, Colloid. Surface. A 156, 3 (1999).
- Y. Mikhaylova, K.-J. Eichhorn, V. Dutschk, K. Grundke, M. Müller and B. Voit, Colloid. Surface. A 297, 19 (2007).
- K. Hinrichs, S.D. Silaghi, C. Cobet, N. Esser and D.R.T. Zahn, Phys. Status Solidi B 24, 2681 (2005).
- K. Hinrichs, M. Gensch and N. Esser, Appl. Spectrosc. 59, 272a (2005).
- M.B. Raschke, L. Molina, T. Elsaesser, D.H. Kim, W. Knoll and K. Hinrichs, ChemPhysChem 6, 2197 (2005).
- K. Hinrichs, D. Tsankov, E.H. Korte, A. Röseler, K. Sahre and K.-J. Eichhorn, Appl. Spectrosc. 56, 737 (2002).
- A. Röseler, in Handbook of Ellipsometry, Ed by A.G. Tompkins and E.A. Irene. William Andrew Publishing—Springer, pp. 763–798 (2005).
- G.E. Jellison, in Handbook of Ellipsometry, Ed by A.G. Tompkins and E.A. Irene. William Andrew Publishing—Springer, p. 282 (2005).
- P. Duckworth, H. Richardson, C. Carelli and J.L. Keddie, Surf. Interface Anal. 37, 33 (2005).
- L. Ionov, A. Sidorenko, K.-J. Eichhorn, M. Stamm, S. Minko and K. Hinrichs, Langmuir 21, 8711 (2005).
- N.A. Nikonenko, K. Hinrichs, E.H. Korte, J. Pionteck and K.-J. Eichhorn, Macromolecules 37, 8661 (2004).
- K. Hinrichs, M. Gensch, N. Nikonenko, J. Pionteck and K.-J. Eichhorn, Macromol. Symp. 230, 26 (2005).
- K. Sahre, K.-J. Eichhorn, F. Simon, D. Pleul, A. Janke and G. Gerlach, Surf. Coatings Technol. 139, 257 (2001).