Today’s pharmaceutical tablets are complex products, and their performance is known to be primarily influenced by the physical and chemical properties of the formulation. The size and spatial arrangement of the active pharmaceutical ingredient (API) within the excipient matrix can influence the bioavailability, dissolution rate and stability of the final drug product.
Vibrational spectroscopic chemical mapping is an established tool within the pharmaceutical industry to examine the size and spatial arrangement of components within tablets. Traditional applications usually involve only examining a single exposed surface area of a sample and thus there are known limitations associated with obtaining domain size statistics from a two-dimensional (2D) chemical image. Recently, the combination of spectroscopic mapping with serial sectioning has enabled full visualisation of the three-dimensional (3D) microstructure of a tablet system to be achieved. A 3D dataset can be reconstructed by stacking individual 2D chemical images collected at regular depth intervals into the sample. To further enhance the added value of 3D spectroscopic mapping methods, this paper outlines the methods required to visualise, process and analyse 3D volumetric data for pharmaceutical applications. This provides a means to quantitatively describe the microstructure of a tablet matrix and is a powerful tool to overcome knowledge gaps in current tablet manufacturing processes, optimising formulation development.
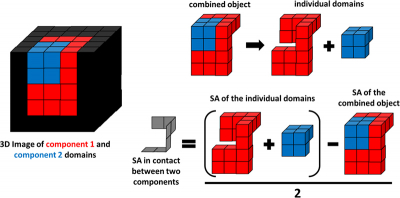
The research team, from the University of Strathclyde and Pfizer, show how the 3D domain size distribution of each component can be determined and used as a comparative tool to understand how the size and shape of domains change throughout the tablet manufacturing process, from raw materials to tablet compaction. Enhanced knowledge regarding the effect of each processing condition on size and shape of the components may lead to optimised manufacturing processes that produce tablets with desired physical and chemical characteristics. The relative position of a component within the drug matrix can also be quantified to assess the spatial arrangement of components within the final drug product. Enhanced understanding regarding the 3D microstructure of a new drug product can provide a baseline understanding of the product with the desired attributes. The spatial arrangement of components within OOS samples can now be quantified and with enhanced process understanding, the root cause may be identified to a single manufacturing step.


