Christopher Burgess
Burgess Analytical Consultancy Limited, “Rose Rae”, The Lendings, Startforth, Barnard Castle, Co. Durham DL12 9AB, UK
John Hammond
Starna Scientific Ltd, 52–54 Fowler Road, Hainault Business Park, Hainault, Essex IG6 3UT, UK
Spectroscopy and spectrometry have been around for a long time. In the “modern” era, spectroscopic instruments have been with us in one form or another for over 70 years. This is particularly true for those old “workhorse” techniques, UV-visible and infrared. So by now it might be reasonable to think that we would enjoy a standardisation and calibration environment that would make the assurance of our spectral data quality a matter of routine. Perhaps or perhaps not! Nothing stands still in the application of analytical science to assuring quality. As the column title rightly suggests Quality does Matter.
The rate of change of instrumentation and its application base accelerated during the 1980s with the availability of substantial data processing power and new technologies being incorporated into the humble spectrometer. Suddenly some of the reference materials we relied upon for qualifying and calibrating our spectrometers were no longer “fit for purpose”. Not only were end users in the laboratory faced with these issues but also the instrument manufacturers. At the same time as these technological changes were occurring so too were regulators. Regulatory bodies in a variety of fields, pharmaceuticals, medical devices, environmental, food to name but a few were becoming increasingly interested in the quality of the data coming from our laboratories to ensure compliance with national and international standards.
When discussing the need and role of standards, we need to consider the major changes that have taken place over the last 50 years in four key areas: The National Metrology Institutes (NMIs), the instrument manufacturers, the user base and the globalisation of regulation through international regulatory bodies.
The National Metrology Institutes (NMIs)
Our NMI laboratories are the guardians of metrological traceability. Spectroscopic science relies upon their maintenance of the fundamental units of length and time and primary metrological standards. This is as true today as it was 70 years ago. What has changed over this period is the ability and willingness of national laboratories to provide secondary reference materials for transfer calibration in the laboratory. For example, in the heyday of the NBS in the US, (National Bureau of Standards now NIST, National Institute of Science and Technology), the Center for Analytical Chemistry in conjunction with the Radiometric Physics Division researched, developed, produced and certified many spectroscopic reference materials as SRMs (Standard Reference Materials) which were widely used in the analytical laboratories covering a wide range of formats, neutral density filters, solutions and solid chemical materials. Indeed many national laboratories offered artefact recalibration services for transmittance, reflectance etc. until relatively recently.
The changing role of national laboratories is typified by NIST’s phased withdrawal from secondary reference material activities over the past 10 years. When stocks of SRMs were depleted, NIST did not have the resource or the inclination to replace them. In fairness to NIST, satisfying the demand for CRMs that grew globally in the 1980s and 1990s was not in their remit. Take NIST SRM 2034, holmium oxide in perchloric acid solution as an example. This was developed in the NBS in the 1980s and became globally adopted for the wavelength scale calibration of UV-visible spectrometers from 240 nm to 640 nm. Full documentation of the work was published in 1986.1 This basic standard has now been phased out although fortunately after work to make it an intrinsic standard was completed.2 What is not so fortunate is the phasing out of the neutral density glasses SRM 930 and 1930 and the reliance on accredited reference material suppliers without a primary source. However, there is an appreciation of the requirement at NIST to still provide a re-certification service for existing SRM 930, 1930 and 2930 sets, at the primary level.
Even NIST at its best did not produce large varieties of SRMs for spectroscopy. It has published 16 Special Publications on spectroscopy over the last 45 years, which is small compared with the total of 153; this is illustrated in Figure 1. It is clear also from this Figure that the National Laboratory sector is not going to be able to satisfy the industrial or regulatory demand across all sectors.
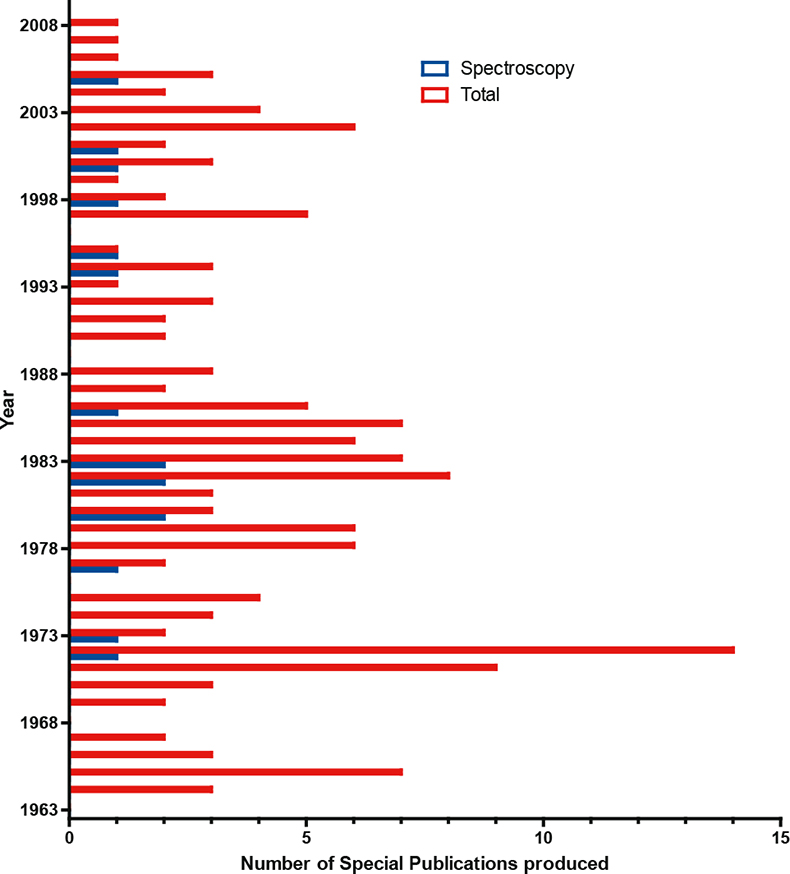
Instrument manufacturing
How has instrument manufacturing changed in the period under question? Essentially, it can be divided up in to three discrete phases, which not surprisingly get shorter, the nearer one gets chronologically to the present day, as the pace of change accelerates. Also at each phase boundary, there is a noticeable change in the physical characteristics of the instruments, usually associated with a reduction in size.
Phase 1: 1940–1975
Instruments manufactured for their optical quality, with minimal electronics. Customers initially relied on the quality of manufacture, to give “peace of mind”, but very soon like-minded individuals established the Photoelectric Spectrometry Group (1948) in the UK to act as a forum where mutual problems could be discussed. Manufacturers relied on the skills of their workforce to precision build the instruments. To date many of the instruments produced in this era still match, or even exceed, the quality of the optics being used in modern instruments. At the end of the era, welcome to the age of the microprocessor, and the age of regulatory control, see below.
Phase 2: 1975–1995
Incorporation of one (or two) microprocessor-based electronic controls, and use of internal control materials, e.g. neutral density glasses. At the start, these filters were simply measured, and then subsequent values measured against these stored values for comparison. By the end of the phase, regulatory pressures require these filters to have traceability (established by an unbroken chain of comparisons) to NMI certified materials, with acceptance criteria built on expanded uncertainty budgets for a given system. Acceleration in the processing power of microprocessor-based systems brought about the birth of the IBM 5150 PC in 1981, and evolution to the next logical step.
Phase 3: 1995 to current
There has been a shift of control and data processing to external computers. Spectrometers are now reduced simply to an “optical bench” with necessary support electronics to provide an electronic data output. Availability of fibre optic technology, semiconductor lasers etc. produced primarily for the telecommunications industry allows the development and production of even smaller semiconductor array-based devices, and sample presentation accessories. Couple this with the ability of systems to process large amounts of data, and you have spectroscopy being taken routinely into areas of the spectrum, previously either unexplored, e.g. NIR, or techniques considered confined to the research lab, e.g. FT-IR, Raman etc.
Dimensionally, the trend has obviously been to progress to smaller and smaller units. However, one could ask is this progress or is there a point at which “small is no longer beautiful”? To quote a certain fictional engineer “... I (we) can’t disobey the laws of physics”.
For applications where high performance is required, you still need good energy throughput, i.e. don’t expect the performance of a unit with an A5 footprint (or smaller) to match that of instrument sized at A0. In the modern environment, the risk analysis, specifically “... is the spectrometer capable of adequately performing the required measurement?” has replaced “... will it physically fit in the laboratory?”. As we see in the next section, this ability to take the spectrometer to the sample, and not the other way around again re-defines the Quality environment required.
The user base
As the instrumentation has changed over the years, so too has the spectroscopic user base. This may be described as a transition from specialist users with detailed knowledge of the inner workings of the instrument towards an application driven “Black box” mentality. As mentioned above, many modern instruments are application software control computers with spectroscopic peripherals. This transition from specialist to workhorse instrumentation is not all bad news of course! The ever increasing spectroscopic application metrology is a major asset to society assuming that we can rely upon the data quality produced.
In our view, one of the major issues of today is that the majority of the user base are too trusting of the numbers generated without appreciating the necessity for Good Spectroscopic Practice and the underlying assumptions and limitations of optical measurements. The problem is exacerbated by our institutions of higher education being either unable or unwilling to teach practical aspects of analytical spectroscopy. From a data integrity point of view the lack of a detailed knowledge of relevant quantum theory is unlikely to have the same impact as a fingerprint on the face of an cuvette or use of a solvent with insufficient transmittance. At the same time we are experiencing a spectroscopic diaspora whereby:
- spectroscopic measurements and testing is moving out of the laboratory into the warehouse, manufacturing at point of use and into the field;
- relatively untrained operators, especially from a spectroscopic view point, may have skill base issues in routine operation.
There remains a need to be assured of holistic operation rather than just modular performance using appropriate reference materials to confirm “fitness for purpose” and/or operability within defined limits.
One source of help, from a user instrumentation operation perspective, is the Instrumental Criteria Sub Committee of the Analytical Methods Committee under the auspices of the Royal Society of Chemistry3 who have worked for many years producing reports and technical briefs on analytical instrumentation which are free for download from their website.
International Standards and their regulatory impact4
As stated above, 1975 can be shown to be a key date, from which many of the international standards and the associated control bodies came into existence.
From 1975 to 1981
- 1975–ISO-REMCO formed
- 1976–USA FDA introduces GLP
- 1977–ILAC formed
- 1978–ISO/IEC Guide 25 issued (to become ISO/IEC 17025 in 1999)
- 1981–OECD GLP Guidelines produced
There then followed a period of relative quiet, until 1987 when ISO issued the 9000 series of standards, and the emphasis on quality was expanded to a much larger audience. In the early ’90s, following a major review with respect to the understanding of traceability in analytical chemistry, CITAC was formed, and the national accreditation bodies implementing accreditation to ISO Guide 25 organised into regional co-operations; namely APLAC in the Pacific Rim, and EA in Europe. The use of accreditation to ISO Guide 25 continued to expand slowly and gain acceptance as more and more laboratories used this route to assist the acceptance of the data being generated, but it was the conversion of ISO guide 25 to ISO standard 17025 in 1999 that really accelerated the process.
Throughout this period, another major standards organisation, ASTM, reflected this increased emphasis on Quality by publishing a range of guidance standards, shown in Table 1. In many areas these standards provide essential guidance in areas not otherwise covered. UV-visible instrument manufacturers use for example E387, as the “de facto” standard for the estimation of instrumental stray light performance. It is interesting to observe the changes brought about by the five-year review cycle, on these standards. In January 2002, ASTM reflected the global nature of its standards work, by changing its name to ASTM International.
Table 1. ASTM international standards for spectroscopy.
ASTM Standard | Title |
E131-05 | Standard Terminology Relating to Molecular Spectroscopy |
E168-99 (2004) | Standard Practices for General Techniques of Infrared Quantitative Analysis |
E169-99 | Standard Practices for General Techniques of Ultraviolet-Visible Quantitative Analysis |
E204-98(2007) | Standard Practices for Identification of Material by Infrared Absorption Spectroscopy, Using the ASTM Coded Band and Chemical Classification Index |
E259-06 | Standard Practice for Preparation of Pressed Powder White Reflectance Factor Transfer Standards for Hemispherical and Bi-Directional Geometries |
E275-01 | Standard Practice for Describing and Measuring Performance of Ultraviolet, Visible and Near-Infrared Spectrophotometers |
E386-90 (2004) | Standard Practice for Data Presentation Relating to High Resolution Nuclear Magnetic Resonance (NMR) Spectroscopy |
E387-06 | Standard Test Method for Estimating Stray Radiant Power Ratio of Spectrophotometers by the Opaque Filter Method |
E573-01 | Standard Practices for Internal Reflection Spectroscopy |
E578-07 | Standard Test Method for Linearity of Fluorescence Measuring Systems |
E579-04 | Standard Test Method for Limit of Detection of Fluorescence of Quinine Sulphate |
E925-02 | Standard Practice for Monitoring the Calibration of Ultraviolet-Visible Spectrophotometers whose Spectral Slit Width does not Exceed 2 nm |
E932-89 (2007) | Standard Practice for Describing and Measuring Performance of Dispersive Infrared Spectrometers |
E958-93 (2005) | Standard Practice for Measuring Practical Spectral Bandwidth of Ultraviolet-Visible Spectrophotometers |
E1252-98(2007) | Standard Practice for General Techniques for Obtaining Infrared Spectra for Qualitative Analysis |
E1421-99 (2004) | Standard Practice for Describing and Measuring Performance of Fourier Transform-Infrared Spectrometers; Level Zero and Level One Tests |
E1642-00(2005) | Standard Practices for General Techniques of Gas Chromatography Infrared (GC-IR) Analysis |
E1655-05 | Standard Practices for Infrared, Multivariate Quantitative Analysis |
E1683-02 (2007) | Standard Practice for Testing the Performance of Scanning Raman Spectrometers |
E1790-04 | Standard Practice for Near Infrared Qualitative Analysis |
E1791-96 (2008)e1 | Standard Practice for Transfer Standards for Reflectance Factor for Near-Infrared Instruments Using Hemispherical Geometry |
E1840-96 (2007) | Standard Guide for Raman Shift Standards for Spectrometer Calibration |
E1865-97 (2007) | Standard Guide for Open-path Fourier Transform Infrared (OP/FT-IR) Monitoring of Gases and Vapours in Air |
E1866-97 (2007) | Standard Guide for Establishing Spectrophotometer Performance Tests |
Abbreviations
APLAC: Asia Pacific Laboratory Accreditation Cooperation; CITAC: Cooperation on International Traceability in Analytical Chemistry; EA: European Cooperation for Accreditation; FDA: US Food & Drug Administration; GLP: Good Laboratory Practice; ILAC: International Laboratory Accreditation Cooperation; OECD: Organisation for Economic Cooperation & Development.
Summary
It is a basic tenet for all analytical scientists that, before the commencement of an analytical procedure, they must ensure the suitability and proper operation of any instrument or system that is part of the measurement process ... in order to demonstrate “fitness for purpose”.5 This challenge is becoming increasingly difficult as spectroscopic applications increase.
This article has hopefully provided an overview and introduction to the topic. In future columns we intend to cover specific application areas in more detail.
References
- NBS Special publication 260–102, Holmium oxide solution wavelength standard from 240 to 640 nm—SRM2034 (1986)
- J.C. Travis et al., J. Phys. Chem. Ref. Data 34(1), 41–56 (2005). https://doi.org/10.1063/1.1835331
- http://www.rsc.org/Membership/Networking/InterestGroups/Analytical/AMC/AMCReports.asp
- For more detail, see P.J. Jenks, “REACH....... into the future? Possible consequences of the EU REACH Directive on the analytical laboratory”, Spectrosc. Europe 20(4), 22 (2008). https://www.spectroscopyeurope.com/quality/reach-future-possible-consequences-eu-reach-directive-analytical-laboratory
- Using analytical instruments and systems in a regulated environment; http://www.rsc.org/images/brief28_tcm18–99611.pdf


