Jürgen H. Gross
Institute of Organic Chemistry, Heidelberg University, Im Neuenheimer Feld 270, 69120 Heidelberg, Germany. E-mail: [email protected], www.ms-ocihd.de>
Introduction
One decade has passed since the introduction of direct sampling and ionisation at atmospheric pressure for mass spectral analysis. Since then, a plethora of methods has become available in this particular field of mass spectrometry (MS), often referred to as ambient MS or ambient desorption/ionisation (ADI). The key feature of ambient MS is that single compounds and mixtures as well as objects can be subjected to mass spectral analysis without, or at least with minimal, pre-treatment, i.e. generally (almost) no sample preparation is required for ambient MS.
Direct Analysis in Real Time (DART) was published early in 2005 as the second ambient MS technique,1 immediately after the introduction of desorption electrospray ionisation (DESI) towards the end of 2004. Today—despite the manifold competing ambient MS techniques that have risen (and fallen) ever since—DESI and DART represent the most established among a total of over 40 related methods. To date, work dealing with DART-MS, basic research as well as manifold analytical applications,2,3 has led to roughly 400 publications with an annual output of 60–70 research articles during the years 2012 to 2014. Certainly, the fact that DART and other ambient ionisation sources can quickly be attached to any atmospheric pressure ionisation interface has substantially contributed to the widespread uses of DART. Commercial availability presents another advantage of DART (and DESI). DART sources are supplied by JEOL (JEOL, Peabody, MA, USA) where it was developed by Cody, Laramee and Durst1 and by IonSense (IonSense, Saugus, MA, USA).
This article first provides a concise description of how DART works and about how DART can be configured to address various analytical problems. The second part discusses a particular example of a DART-MS application by presenting the analysis of polydimethylsiloxanes (PDMS) from silicone oil, silicone rubber articles in daily use and to detect PDMS on food. Of course, there are numerous other examples of uses of DART-MS for food quality and safety analysis.4
DART ionisation
The generation of sample ions proceeds in a sequence of gas-phase reactions that is initiated by a corona-to-glow type of DC discharge in pure helium gas. Other gases like argon or nitrogen have also been employed, but examples of their successful analytical uses are rare. The discharge creates electronically excited helium atoms, He*, that store 19.8 eV of energy. Helium ions, generated by the corona discharge as a by-product as well as free electrons, are trapped by passing the helium flow through grid electrodes of negative and positive polarity, respectively. Then, the energised helium gas is usually heated prior to its exit into the atmosphere. There, the majority of He* is instantaneously consumed by ionising atmospheric nitrogen via Penning ionisation: He* + N2 ® He + N2+• + e–. The N2+• ions formed undergo dimerisation in a termolecular reaction (one N2 neutral is needed to carry away the excess energy) to yield N4+• ions that may then ionise atmospheric water by charge transfer. Water molecular ions, H2O+•, tend to react with neutrals of their own species to form H3O+ and OH•. Now, H3O+ ions become solvated by additional H2O to yield [(H2O)n + H]+ cluster ions (n = 1–5). Thus, at the open atmosphere, a complex mixture of reagent ions is formed within milliseconds, comprising N2+•, N4+•, H2O+•, H3O+ and [(H2O)n + H]+ cluster ions. Essentially, the ionisation processes of DART closely resemble those of atmospheric pressure chemical ionisation (APCI).
Analyte molecules, M, can therefore be ionised in numerous ways. First, Penning ionisation leading to positive analyte radical ions, M+•, might occur if analyte molecules happen to collide with He* directly at the helium exit. Second, and more important, charge transfer can yield M+• too. Charge transfer is mainly effected by N4+•, H2O+• and O2+• ions (for simplicity, oxygen was neglected in the previous paragraph). Third, proton transfer to molecules having higher proton affinity (PA) than water (PAH2O = 697 kJ mol–1) can deliver [M + H]+ ions, i.e. essentially all organic molecules having at least one heteroatom will undergo proton transfer. And finally, electrophilic addition, typically of NH4+ formed from ubiquitous NH3, can contribute by formation of [M + NH4]+ adduct ions. Overall, it depends on the properties of the analyte (ionisation energy, proton affinity etc.) as to which of the above pathways will dominate in positive-ion formation.
Negative ions may also be formed under DART conditions. Free thermal electrons, delivered as by-products of positive-ion formation processes, can be captured by analyte molecules to generate M–• ions or by atmospheric oxygen to form O2–• ions. O2–• ions can attach to M and deliver [M + O2]–• or [M + O]– ions. Alternatively, nucleophilic addition of OH– can result in [M + OH]– ions. Depending on the presence of halogens, either as part of analytes themselves or provided by residual halogenated solvent, [M + halogenide]– ions can be observed. In particular when more or less acidic analytes are present, ion–molecule reactions may lead to deprotonation, i.e., to [M – H]– ions. Again, it depends on the analyte as to which type of negative ions is going to prevail.
Also, one has to keep in mind that different types of analyte ions may occur simultaneously (see Table 1), e.g. [60]fullerene in negative-ion mode readily forms [C60]–•, [C60O]–, [C60OH]– and [C60O2]–• as it possesses high electron affinity and is also prone to oxidation.3
Table 1. Analyte ion formation in DART-MS.
| Ion polarity | Property of analyte | Ions preferably formed |
|---|---|---|
| Positive | Non-polar | M+• |
| Low to medium polarity | M+•, [M + H]+, [M + NH4]+ | |
| High polarity | [M + H]+, [M + NH4]+ | |
| Salts (organic or ionic liquids) | Cat+, [CatnAnn–1]+ | |
| Negative | High electron affinity | M–• |
| Acidic | [M – H]– | |
| Readily oxidised | [M + O2]–•, [M + O]– | |
| Electrophile substrate | [M + OH]–, [M + Cl]–, [M + Br]– | |
| Salts (organics or ionic liquids) | An–, [Catn–1Ann]– |
Cat, cation; An, anion
Heating of the energised helium gas is normally required to assist analyte evaporation from the sample surface. Depending on the volatility of an analyte, either gentle warming of the helium to 50–100°C or strong heating to 400–500°C may be necessary for sufficient analyte ion formation; typically, 200–350°C is employed. While too low a gas temperature does not provide sufficient partial pressure, excessive heat may cause faster evaporation than the instruments spectral acquisition rate or just lead to thermal decomposition products.
Typically, DART-MS is applied for analytes in the m/z 50–1200 range, nonetheless, it may be used to m/z 3000–5000 provided the analyte is thermally stable enough to withstand the ionising gas at 500°C. Thus, some optimisation of the helium gas temperature is advised for successful DART analyses.3
DART-MS configurations
DART-MS is versatile in that it can be used in different configurations. The main distinguishing feature is whether DART is to be applied in (classic) surface mode or in transmission mode (Figure 1). In surface mode, the stream of ionising gas is directed onto the surface to be analysed. This mode is clearly preferred when objects such as tablets or plant material are to be subjected to DART analysis. For routine applications of single compounds or simple mixtures, the transmission mode is better suited. In this set up, the analyte is deposited onto a fine wire mesh either directly or from solution (which means sort of a simplistic sample preparation). The mesh provides a larger sample surface when placed into the ionising gas and allows for better reproducibility than direct analysis of objects having variable surface roughness or being positioned at differing positions and angles relative to the DART ionisation source and sampling orifice. If DART-MS is run on the JEOL AccuTOF series of instruments, the ionisation source is immediately positioned in front of the sampling cone of the API interface. For all other instrument manufacturer configurations, there is a need to mount the so-called Vapur Interface as an additional stage of pumping to avoid excessive helium flow into the mass analyser. The Vapur Interface consists of a 50-mm long ceramic tube having an inner diameter of 5 mm that guides the sampled gas from the atmosphere to the orifice of the API interface that is held at reduced pressure by means of a small membrane pump.

Experimental
Measurements of all PDMS-type samples were made using a Bruker Apex-Qe Fourier transform ion cyclotron resonance (FT-ICR) mass spectrometer (Bruker Daltonik, Bremen, Germany) equipped with a 9.4 T superconducting magnet and an ESI-to-MALDI switchable Dual Source MTP. Ions were accumulated in the RF-only hexapole for 1.0 s and mass analysed by FT-ICR. Broadband spectra of 1 M data size accumulated from 16 transients were acquired in the m/z 200–2500 range.
The DART-SVP ionisation source (IonSense, Saugus, MA) was mounted on the electrospray ionisation (ESI) interface of the ion source via the so-called Vapur Interface that provides an additional pumping stage. The Open Source (IonSense, Saugus, MA) was employed for mass calibration in transmission mode. External mass calibration in positive-ion DART mode was established using a solution of silicone oil (1 mg mL–1), 3 µL of which were placed on the mesh of the Open Source (OS) cards. The temperature of the DART source was set to 300°C.
For silicone rubber objects, DART analyses were performed in surface mode. The DART-SVP ionisation source was mounted at an angle of 45° relative to the axis of the ceramics tube of the Vapur Interface. The angle mount was recessed to the 20-mm position on the scaled rail and the ionisation source was shifted vertically by 6 mm using the knurled nut for adjustment of the device. Then, objects were manually positioned for exposure to the ionising gas (Figure 2). The DART gas was also set to 300°C. More detailed descriptions of the experimental conditions are published elsewhere.5,6,7

DART-MS analysis of polydimethylsiloxanes
In positive-ion DART-MS, polydimethylsiloxane (PDMS) gives rise to abundant ions. The silicones show three major ion series that are all spaced at Dm/z = 74.018791, which is characteristic of the [(CH3)2SiO] repeat unit. Of course, these signals also show isotopic patterns that clearly reveal the presence of several Si-atoms.
The first PDMS ion series may occur at nominal m/z = (n ´ 74) – 15, i.e., at m/z 207, 281, 355 etc. These low-mass ions formally represent cyclic fragments minus one methyl group, [(OSi(CH3)2)n – CH3]+. Such ions are presumably formed by loss of CH4 or larger moieties from protonated molecules. The second ion series, cyclic silicone fragments of the type [(OSi(CH3)2)n + H]+, appear at nominal m/z = (n ´ 74) + 1. In DART-MS spectra they are usually observed from m/z 223 to m/z 889. The third series represents the most important one and is obtained by ammonium ion adduct formation instead of protonation. It comprises [(OSi(CH3)2)n + NH4]+ ions that deliver peaks at nominal m/z = (n ´ 74) + 18. This series generally starts from m/z 462 and extends beyond m/z 2000 depending on the analyte and clearly dominates the DART-MS spectra of all sorts of PDMS samples. One should keep in mind that the ions observed do not necessarily reflect the intact PDMS molecules.8
These characteristics allowed one to develop a procedure for mass calibration in transmission mode DART-MS based on silicone oil or silicone grease as low cost and readily available mass calibration compounds. Suitable m/z values were selected from either of the three ionic series and a reference mass list was compiled. To run a mass calibration, 3 µL of silicone oil dissolved in dichloromethane (1 mg mL–1) is applied to the mesh of an OS card and subjected to transmission mode DART analysis with the gas set to 300°C. Regulating the gas temperature by 50°C up or down allows for shifting the ion distribution towards ions of higher or lower mass, respectively. This procedure allows for mass calibration on silicone ions from about m/z 200 to 2000.5
It turned out that not only PDMS samples of a liquid or waxy consistency were suitable for DART analysis. Flexible silicone rubber as employed in the manufacture of household utensils such as baking moulds or dough scrapers and for baby articles like pacifiers, nipples and teething rings can also be analysed. To do so, surface mode DART was employed. For optimisation, a series of temperature-dependent spectra was acquired and based on the results, 300°C was selected as the standard helium temperature. This setting yielded strong signals for all sorts of silicone rubber items without causing any visible permanent changes of the surfaces.6 However, some coloured silicone rubber samples exhibited slightly thermochromic behaviour, and thus, revealed the actual size of the sampling area as being about 8 mm in diameter. In addition, a coarse quantification of the amount of PDMS released during one 16 s run could be accomplished. Depending on the type of silicone rubber, several to several ten micrograms of PDMS were released. This significant release of material posed the question as to whether PDMS will be extracted into baked goods when silicone rubber moulds are used for such as cake-making. A simulated baking experiment (1 g of the mould in 2 mL of rapeseed oil at 180°C for 1 h) revealed that 2–2.5 µg of PDMS was contained in 2 µL of that oil after having been in contact with the silicone rubber mould. In terms of concentration, this indicated roughly 1 µg mg–1 PDMS in the fat content of a cake.6
Further, it was shown that PDMS migrates from silicone rubber moulds into baked goods when such moulds were used for baking. Several muffins were analysed after having been baked in either silicone rubber moulds or metal moulds. DART-MS analysis of the muffin surfaces clearly revealed a PDMS ion distribution showing a close resemblance to those obtained by direct analysis of the flexible baking moulds.7
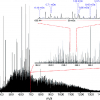
Parchment paper is another sort of household aid frequently employed in the preparation of baked goods. These papers are advertised as non-stick or non-adhesive and suggest being ecologically worthwhile because they are made of unbleached paper. While some clearly state they are silicone coated others just highlight their practical quality. Thus, parchment paper was also analysed by positive-ion DART-MS applying the same settings as established in previous work.6,7 The spectra of several brands of parchment paper exhibited close resemblance in terms of intensity of the PDMS ion peaks as well in the m/z range covered by PDMS ions. The spectrum shown in Figure 3 may be taken as a characteristic example of silicone-coated parchment paper. This spectrum also exemplifies the general appearance of positive-ion DART-MS spectra of silicone oil and silicone rubber; the main difference being the respective distribution over the m/z range and to some extent the intensity of signals. As expected, the most abundant ion series belongs to ions of the general formula [(OSi(CH3)2)n + NH4]+, here ranging from n = 10 to n = 24. It starts at m/z 758.22 (monoisotopic ion) and vanishes into the baseline at m/z 1796.45 (most intensive peak of isotopic pattern). Figure 3 includes an expanded view comparing the experimental and calculated isotopic pattern of the ion [C30H94NO15Si15]+. It thereby provides very good agreement with what is expected in the case of such a large number of Si atoms. The resolution at m/z 1130.31240 is 46,000, which is well sufficient to deal with this sort of analyte. Selected accurate mass data and ionic formulas of the monoisotopic ions from n = 11 to n = 16 show that the formulas were normally assigned within a 2-ppm window for mass error.
![Figure 3. Positive-ion DART-FT-ICR mass spectrum of Selex Selection non-stick parchment paper. The spectrum shows a distribution of signals due to PDMS ions of the general formula [(OSi(CH3)2)n + NH4]+, ranging from n = 10 to n = 24; m/z labels refer to the most intensive peak of the respective isotopic pattern. Insert a) presents an expanded view of the experimental and calculated isotopic pattern of the ion [C30H94NO15Si15]+ and demonstrates very good agreement with what is expected in case of so many Si atoms. Resolution is 46,000 at m/z 1130.31240. Insert b) provides selected accurate mass data and ionic formulas of the monoisotopic ions from n = 11 to n = 16. Generally, formulas were assigned within a 2-ppm window for mass error. DartMS-fig3](/sites/default/files/articles/DartMS-fig3.jpg)
Conclusions
All data discussed here were obtained on an FT-ICR mass spectrometer. FT-ICR instruments certainly provide resolving power and mass accuracy in excess of what would be required to obtain reliable data from these types of samples. Unfortunately, FT-ICR is not the greatest technique in terms of sensitivity. One may expect analysers based on time-of flight (TOF) and Orbitrap technologies to be equally well or even better suited for this kind of analyses. Higher sensitivity would certainly be advantageous when it comes to the detection of PDMS transferred to food after having been in contact with silicone rubber moulds or silicone-coated parchment paper, for example.
The findings presented here on the one hand demonstrate the suitability of DART-MS for PDMS analysis and on the other indicate that there is an exposure to PDMS upon use of silicone rubber articles.
References
- R.B. Cody, J.A. Laramee and H.D. Durst, “Versatile new ion source for the analysis of materials in open air under ambient conditions”, Anal. Chem. 77, 2297–2302 (2005). doi: http://dx.doi.org/10.1021/ac050162j
- E.S. Chernetsova, G.E. Morlock and I.A. Revelsky, “DART mass spectrometry and its applications in chemical analysis”, Russ. Chem. Rev. 80, 235–255 (2011). doi: http://dx.doi.org/10.1070/RC2011v080n03ABEH004194
- J.H. Gross, “Direct Analysis in Real Time—A critical review of DART-MS”, Anal. Bioanal. Chem. 406, 63–80 (2014). doi: http://dx.doi.org/10.1007/s00216-013-7316-0
- J. Hajslova, T. Cajka and L. Vaclavik, “Challenging applications offered by direct analysis in real time (DART) in food-quality and safety analysis”, Trends Anal. Chem. 30, 204–218 (2011). doi: http://dx.doi.org/10.1016/j.trac.2010.11.001
- J.H. Gross, “Polydimethylsiloxane-based wide range mass calibration for Direct Analysis in Real Time mass spectrometry”, Anal. Bioanal. Chem. 405, 8663–8668 (2013). doi: http://dx.doi.org/10.1007/s00216-013-7287-1
- J.H. Gross, “Analysis of silicones released from household items and baby articles by Direct Analysis in Real Time-mass spectrometry”, J. Am. Soc. Mass Spectrom. 26, 511–521 (2015). doi: http://dx.doi.org/10.1007/s13361-014-1042-5
- J.H. Gross, “Polydimethylsiloxane extraction from silicone rubber into baked goods detected by direct analysis in real time mass spectrometry”, Eur. J. Mass Spectrom. 21, 313–319 (2015). doi: http://dx.doi.org/10.1255/ejms.1333
- M.C. Bridoux and X. Machuron-Mandard, “Capabilities and limitations of Direct Analysis in Real Time orbitrap mass spectrometry and tandem mass spectrometry for the analysis of synthetic and natural polymers”, Rapid Commun. Mass Spectrom. 27, 2057–2070 (2013). doi: http://dx.doi.org/10.1002/rcm.6664


