Malvina G. Orkoulaa and Christos G. Kontoyannisa,b
aDepartment of Pharmacy, University of Patras, Rio-Patras, Greece. E-mail: [email protected]
bICE-HT/FORTH, PO Box 1414, University Campus, Rio-Patras, Greece
Introduction
The term “biogenic” comes from the Greek words bios (way of life) and gennan (to produce) and refers to something produced or originating from a living organism; something produced during a biological process. Biogenic materials can be chemical substances, crystal formations, gaseous mixtures, secretions from plants, animals or human organisms. They can be either organic or inorganic.
Tissue is a cellular organisational level intermediate between cells and a complete organism. A tissue is an ensemble of similar cells from the same origin that together carry out a specific function.
Due to the plethora and the diversity of compounds in biological organisms, their identification is a rather difficult task. In several cases, the similarities among the compounds or the nature of the information that a researcher is seeking, e.g. the exact location of a material in a tissue or the subtle changes/differences induced in a biomacromolecule such as collagen, render most analytical techniques useless. Application of Raman spectroscopy, a rather versatile analytical tool, can offer ways to overcome such problems. Despite the inherent weak signal, Raman spectroscopy offers some unique advantages. As a vibrational technique a Raman spectrum can be used for identification purposes, like an infrared (IR) spectrum, but unlike IR spectroscopy, Raman spectroscopy faces no problem when dealing with water, a compound abundant in tissues, since it is a weak Raman scatterer. Other advantages include, but not limited to, its capability of “mapping” an area of a tissue of interest and the differentiation among polymorphs and pseudo-polymorphs. In our laboratory, for two decades now, we have been exploring the application of this powerful spectroscopic tool on different types of biogenic materials and biological tissues, some examples of these are discussed below.
Application examples
Urinary stones
Urinary stone is a solid concretion or crystal aggregation formed in the kidneys from dietary minerals in the urine.
The Raman spectral differences for very similar compounds such as calcium oxalate monohydrate (COM) and calcium oxalate dihydrate (COD), found to coexist in urinary stones, were explored and have been reported.1 In another more difficult case, multilayer deposition of COM, COD, hydroxyapatite (HAP) and dicalcium phosphate dihydrate (DCPD) resulted in a very complex stone.2 For this study, the capability of Raman spectroscopy for “mapping” the surface of a material in a non-destructive way was used. The results were compared to those obtained by Fourier transform IR (FT-IR) spectroscopy and X-ray diffraction (XRD) analysis. Raman spectra had distinct and sharp bands in contrast to those obtained by FT-IR spectroscopy. Powder X-ray diffraction could not be used for topological analysis since grinding of the stone would have been necessary.
Encrusted deposits
A prostatic stent was surgically removed from a patient’s urethra due to clogging (see Figure 1A). A urinary stone entrapped in the lumen was also harvested. A transverse cross-section revealed a ring-like deposition indicating a complex formation process. A thick core of (~3.8 mm radius) was surrounded by a thin layer (0.2 mm radius) of different chemical composition (see Figure 1B). Raman and FT-IR spectroscopy were employed for the analysis and six different substances, a very rare occurrence, were detected, yielding complex spectra. Struvite (STR), HAP, COM, uric acid (UA), potassium urate (PU) and ammonium urate (AU) were the main components of the concretion formed on the metallic stent.3 Based on these findings, an interpretation of the pathological condition and evolution of deposition was attempted as follows.

Figure 1. (A): The prostatic stent with the encrustation and the urinary stone in the lumen, (B): The cross-section of the urinary stone. The thick nucleus and the surrounding layer are discernible.
The presence of distinct regions, a central core and a folding layer of different composition, indicates that the stone was formed gradually under different environments. The core, which consisted of uric acid, was formed in an acidic environment, probably in the patient’s bladder and then moved to the lumen. There, precipitation of a relatively thin layer consisting of STR, AU and PU occurred, covering the urolith nucleus, before the stone was surgically removed. The occurrence of struvite, which is the major component of encrustations formed on metallic surfaces, is closely related to infection. In this situation, urease-producing bacteria caused hydrolysis of urea and subsequent elevation of pH. In alkaline environment, and supposing urine was supersaturated with respect to urates, formation of potassium or ammonium urate should be anticipated. The presence of calcium oxalate and hydroxyapatite on the ring’s surface in direct contact with the stent could be explained by epitaxial growth on different salt urate crystals.
Bone (osteoporosis)
Bone is a composite material. It consists of bioapatite crystals (a biological analogous to hydroxyapatite) embedded in a collagen network. Osteoporosis is a metabolic bone disease which affects skeletal integrity, reduces its strength and leads to increased fracture incidents. Bone composition and quality can be evaluated using Raman
spectroscopy.
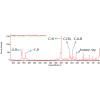
A typical Raman spectrum of bone can be seen in Figure 2. Overlapping of peaks results in spectrum complexity and deconvolution is necessary across broad spectral regions to reveal constituent peaks.
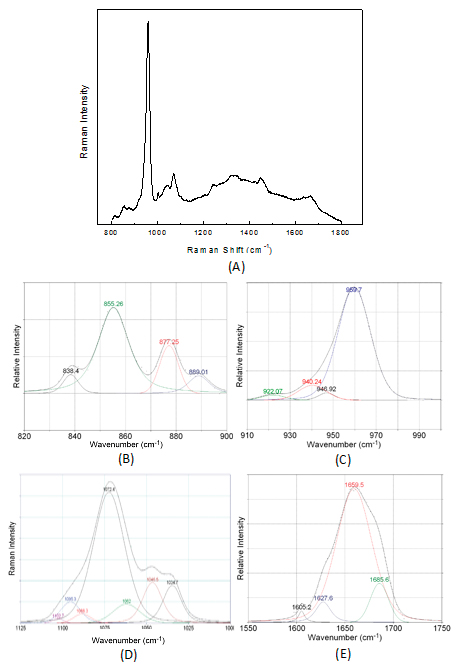
Figure 2. Raman spectrum of bone (A) and deconvolution of peaks under (B) collagen proline and hydroxyproline, (C) bioapatite, (D) carbonate, (E) amide I spectral regions.
Bone compositional data can be obtained from the band intensities ratio of mineral to organic matrix.4 In osteoporosis, the mineral-to-matrix ratio is found to decrease due to a decrease of mineral content. The mechanical properties of the remaining bioapatite are degraded as well. Two indices for the quality of mineral are implemented. The carbonate-to-phosphate ratio, which corresponds to the percentage of phosphate substitution and the crystallinity of bioapatite. High phosphate substitution leads to brittle bone tissue. Mineral crystallinity is a parameter which has also been connected to pathological condition or bone ageing. It can be estimated from the inverse of the phosphate 959 cm–1 bandwidth at half-maximum. For example, osteoporotic tibia obtained from ovariectomised rats5 exhibited a statistically significant increase in crystallinity and carbonate content accompanying the mineral-to-matrix ratio decrease, suggesting existence of not only less mineral but brittle material as well.
Alterations in collagen network, i.e. alterations in cross-linking, are also imprinted within a Raman spectrum. The intermolecular cross-linking of bone collagen is one of the most important molecular properties of collagen and provides fibrillar scaffolds with important mechanical properties such as tensile strength and viscoelasticity. A metric for this parameter is the intensity ratio of 1660 cm–1/1685 cm–1 bands in the amide I spectral region, which refers to the non-reducible/reducible collagen crosslinking.5
A considerable increase for the (1660 cm–1/1685 cm–1) ratio, compared to the control, was observed for osteoporotic rat tibia indicating an increase in the amount of the non-reducible (trivalent) cross-links due to transformation of the reducible (divalent) and/or subsequent decrease of the reducible or less formation of them. Thus, analysis of the amide I region in Raman spectra suggested that severe deterioration of bone architecture takes place in osteoporosis. Collagen removal not only increases but the network becomes stiffer, more rigid and loses its elasticity. It is important to note that information on collagen cross-linking cannot be taken up by any biochemical marker measurements such as amino-terminal collagen crosslinks (NTx) or any other clinical examination.
Cartilage (osteoarthritis)
Cartilage is a flexible connective tissue found in many areas in the bodies of humans and other animals, including the joints between bones. Osteoarthritis is a pathological condition that inflicts damage on the hip and knee joint, and leads to cartilage degeneration and subchondral bone damage.
Femoral heads
Micro-Raman spectroscopy was used for the study of osteoarthritic human femoral heads, a section of which is shown in Figure 3.6 Spectral differentiation between subchondral bone and articular cartilage, actually between collagen types I and II, was accomplished in healthy areas in the rims of the femoral head (near the neck) where an intact layer of healthy cartilage surrounds the subchondral bone. The key is that the amide I band in Raman spectra of bone and cartilage comprises a secondary structure which is a characteristic feature of collagen type. On spots of bone and articular cartilage, the amide I band morphology differs significantly. In cartilage a broad peak at 1668 cm–1 dominates the spectral region and varies largely through to a narrow peak at 1657 cm–1 of subchondral bone spectrum.
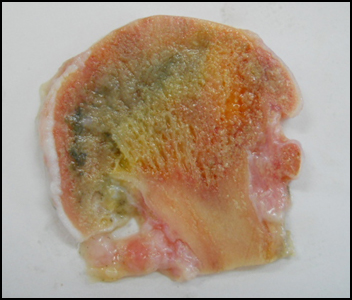
Figure 3. Section of a 70-year old male human femoral head.
As we move, following the perimeter, towards the top of the femoral head section, degeneration of cartilage, due to movement friction, is visible. Mapping of this region, starting from the external surface towards the interior of the section, reveals different spectral features of osteoarthritis. In one case, the presence of bone (collagen type I and bioapatite) dominated spectra from the outer spot scanned. This was due to severe cartilage degeneration and subsequent uncovering of subchondral bone. In a second case, spectral features of calcified cartilage, namely collagen type II and apatitic formations, were observed in the same spectrum. Calcified cartilage switches to areas where cartilage (collagen type II) and bony tissue (collagen type I and bioapatite) coexist. This is due to embedding of cartilage into subchondral bone. Calcified cartilage and bone/cartilage mixtures were recorded at depths of several millimetres towards the centre of the femoral head and might indicate intermediate stages in the progress of osteoarthritis.
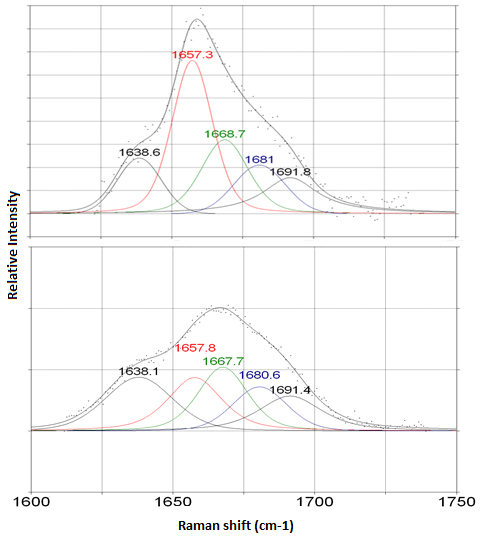
Figure 4. Coexistence of collagen type I (1657 cm–1) and collagen type II (1668 cm–1) sub-bands under the amide I band envelope of an osteoarthritic area; Raman spectrum recorded on the human femoral head section.
Meniscus
Human meniscus is a crescent-shaped fibrocartilagenous structure that partly divides the knee joint cavity. It is vulnerable to chemical changes caused by pathological conditions. The meniscus consists of fibril-forming collagens (60–70% of tissue’s dry weight), proteoglycans, matrix glycoproteins and elastin. The main types of collagen found are type I and II. Proteoglycans are complex formations of proteins with one or more glycosaminoglycan (GAG) chains. A meniscus consists of chondroitin 6-sulfate (C6S) (40%), chondroitin 4-sulfate (C4S) (10–20%), dermatan sulfate (DS) (20–30%) and keratan sulfate (KS) (15%).
Micro-Raman spectroscopy was employed on human menisci samples.7 It was anticipated that GAGs should exist in the healthy areas and their concentration should increase in the osteoarthritic areas. The main Raman spectroscopy peaks of chondroitin 6-sulfate (which is the most abundant GAG on human meniscus), occur at 882 cm–1 (assigned to CH vibration), 939 cm–1 (assigned to C–O–C vibration) and 1064 cm–1 (assigned to OSO–3 vibration). The main peaks of chondroitin 4-sulfate occur at 853 cm–1 and 886 cm–1, (attributed as a doublet band to CH vibration), 939 cm–1 (assigned to C–O–S vibration) and 1069 cm–1 (assigned to OSO–3 vibration). Dermatan sulfate’s main peaks are at 866 cm–1 (assigned to the antisymmetric vibration of C–O–C), and near 1065 cm–1 (assigned to C–O–S vibration).
From the recorded spectra it becomes obvious that osteoarthritis on a human meniscus is associated to collagen type I and the selective presence of dermatan sulfate, while the healthy state of a meniscus is correlated to pure collagen type II or the coexistence of collagen types I and II, along with chondroitin sulfate. Bioapatite and calcite crystals along with pure collagen type II, or coexistence of collagen type I and II, were found on the rim of the specimen. Bioapatite’s characteristic band is found at 960 cm–1, while calcite is identified by the band at 1087 cm–1. This finding suggests that crystallisation was induced during osteoarthritis.
Summary
Raman spectroscopy was successfully used for the identification of the compounds present in biogenic materials. In some of the cases application of Raman spectroscopy yielded information that surpassed that obtained from the currently most commonly used techniques of FT-IR spectroscopy and XRD. Compositional data and quality assessment were extracted for biological tissues, after appropriate processing of their Raman spectra. This type of information is directly related to pathological states such as osteoporosis and osteoarthritis. Furthermore, the Raman spectra were easy to obtain and no treatment of the sample was needed.
References
- C.G. Kontoyannis, N. Bouropoulos and P.G. Koutsoukos, “Use of Raman spectroscopy for the quantitative analysis of calcium oxalate hydrates: application to urinary stones”, Appl. Spectrosc. 51, 64 (1997). doi: http://dx.doi.org/10.1366/0003702971938777
- C.G. Kontoyannis, N. Bouropoulos and P.G. Koutsoukos, “Urinary stone layer analysis of mineral components by Raman spectroscopy, IR spectroscopy and x-ray powder diffraction. A comparative study”, Appl. Spectrosc. 51, 1205 (1997). doi: http://dx.doi.org/10.1366/0003702971941764
- C. Kontoyannis, N. Bouropoulos, H. Dauaher, C. Bouropoulos and N. Vagenas, “Analysis of prostatic stent encrustation and of entrapped urinary stone using FT-IR and FT-Raman spectroscopy”, Appl. Spectrosc. 54, 225 (2000). doi: http://dx.doi.org/10.1366/0003702001949140
- Karabas, M.G. Orkoula and C.G. Kontoyannis, “Calibration models for the quantitative analysis of bone (collagen and bioapatite) using Raman spectroscopy”, J. Biophotonics 6, 573–586 (2013). doi: http://dx.doi.org/10.1002/jbio.201200053
- M.G. Orkoula, M.Z. Vardaki and C.G. Kontoyannis, “Study of bone matrix changes induced by osteoporosis in rat tibia using Raman spectroscopy”, Vibr. Spectrosc. 63, 404–408 (2012). doi: http://dx.doi.org/10.1016/j.vibspec.2012.09.016
- M.Z. Vardaki, D.J. Papachristou, P. Megas, C.G. Kontoyannis and M.G. Orkoula, “Chemical mapping of a human osteoarthritic femoral head section using micro-Raman spectroscopy”, in Proceedings of 9th Panhellenic Scientific Conference in Chemical Engineering, CH0358 (2013). http://9pesxm.chemeng.ntua.gr/fullpapers/CH0358.pdf
- P. Papaspyridakou, D. Papachristou, P. Megas, C. Kontoyannis and M. Orkoula, “Unraveling the chemical changes induced on human meniscus by osteoarthritis using micro-Raman spectroscopy”, in Proceedings of 9th Panhellenic Scientific Conference in Chemical Engineering, CH0360 (2013). http://9pesxm.chemeng.ntua.gr/fullpapers/CH0360.pdf


