Matthew J. Sheaa and Mark H. Wallb
Thermo Fisher Scientific, Madison, WI 53711, USA. E-mail: [email protected]
Raman spectroscopy is a valuable measurement technique for characterising carbon nanomaterials. However, it is important to understand what is actually represented in the measurement before attempting to draw any conclusions from it. Typical samples of carbon nanomaterials include a range of related structures with diverse characteristics. This article provides a good understanding of what is represented in a Raman spectrum of carbon nanotubes and explains how to optimise the measurement to ensure capturing all the subtleties that may be present in a collection of carbon nanotubes.
The physical structure of carbon nanotube samples has direct implications on the Raman measurement. Carbon nanotubes will almost always appear as loose, uniform black powders when they are in their bulk form. However, there is actually significant diversity within these samples which affects both the material properties and the Raman spectrum of the material. It is not uncommon for samples to have significant levels of carbonaceous impurities, defective nanotubes and smaller levels of other irregularities such as residual catalyst. In addition to this, the number of nanotube walls can vary within the tube—single, double or multiwall—as well as tube diameter, chirality and length. All of these variation sources will result in at least a small level of difference between Raman spectra.
Given THAT these factors range from sample to sample, reflecting all facets of the Raman spectrum of these materials is critical so we are not misled by a spectrum which only captures one variant of the nanotubes that are present. We will begin with the interpretation of the Raman spectrum of carbon nanotubes. Following this, we will discuss some of the carbon nanotube properties that could detrimentally affect their Raman measurement with strategies to limit their impact. Two sampling methodologies will be presented that allow one to obtain an accurate assessment of a bulk collection of carbon nanotubes. Finally, we will show how these techniques may be used to gauge the separation of semiconducting carbon nanotubes from raw carbon nanotubes.
The Raman spectrum of carbon nanotubes
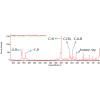
A typical Raman spectrum of carbon nanotubes is presented in Figure 1. The Raman spectrum of carbon nanotubes contains several important features, as outlined by Dresselhaus et al.1 The “G” band, near 1580 cm–1 is commonly associated with the sp2 hybridised carbon atoms in the nanotube wall. In single-walled carbon nanotubes (SWCNTs), the “G” band has two peaks, the stronger at 1590 cm–1 associated with vibrations of carbon atoms along the nanotube axis, while the smaller, peaking below 1570 cm–1, is associated with vibrations around the circumference of the nanotube. Metallic SWCNTs present much taller and broader peaks at 1550 cm–1. The absence of this peak is indicative of low concentrations of metallic nanotubes. Defects and sp3 hybridised carbon atoms give rise to a “D” band, centred at 1300 cm–1, the height of which is inversely related to nanotube quality. There is a resonant “2D” peak at 2600 cm–1 occurring as an overtone of the “D” band.

Between 200 cm–1 and 300 cm–1 the radial breathing modes (RBMs) of single-walled carbon nanotubes occur. The position of Raman peaks (w cm–1) corresponding to individual chiralities of nanotube are determined by the diameter (d nm) of the nanotube according to the relation
![]()
where A and B are parameters related to the nanotube environment. Therefore, particular chiralities of nanotube may be identified from the Raman spectrum peaks at these wavenumbers.
How do we ensure that the spectra that we collect represent all of the diversity that is present in the sample?
Figure 2 shows the dark field image of a compressed sample of SWCNTs taken at 50× magnification. These carbon nanotubes were characterised by the manufacturer as being >90% pure and containing SWCNTs with a diameter of 1–2 nm. Shown, also, are four Raman measurements that were collected from the indicated locations in the video image. The most apparent difference is in the relative intensity of the G- to D-band ratio. While spectra 1 and 2 are quite similar there is a pronounced difference between these and spectra 3 and 4 where the D-band exhibits a much larger intensity relative to the G-band. The larger D-band in spectra 3 and 4 indicates the presence of some SWCNT with defects and/or the presence of some MWCNTs (multi-walled carbon nanotubes). The variability observed in these measurements demonstrates the need for more than just a single Raman measurement when assessing the composition of a large sample of nanotubes. If care is not taken to collect more than a small number of Raman measurements the assessment of the composition of the nanomaterial may not be representative of the bulk composition. It is therefore essential to take more than a few Raman measurements of a sample in order to get a good assessment of a sample’s composition. One approach that provides a large number of measurements and is an effective means of sampling is to move the collection of nanotubes in small steps under a Raman microscope and take a Raman measurement at each position. Raman microscopes can be configured with automated sample stages that allow for small precise steps and software can coordinate the collection of Raman at each point. Statistics can then be applied to the collection of spectra in order to obtain an average spectrum, which will be a good representation of the carbon nanotubes in the sample. The average spectrum can now be viewed as truly representative of the bulk material it has been sampled from. This spectrum, by virtue of sampling a large area, avoids the possibility of over-emphasising the importance of a minor component in the sample as may happen when taking just a few point measurements. Figure 3 shows the video image of the multipoint analysis of an area and the resulting average spectrum. There is an alternative rapid measurement that can quickly give insight into the collection of nanotubes without the need of moving the sample. This bulk measurement method is a special application sampling technique called variable dynamic point sampling or VDPS and is available on the Thermo Scientific DXR SmartRaman spectrometer, which was used for these measurements. Whereas, the Raman mapping measurement involves keeping the laser excitation held rigidly in one place and moving the sample via the automated stage to collect Raman spectra from different locations in the analysis area; VDPS obtains a representative Raman measurement by keeping the sample stationary and rastering the laser rapidly (100 passes/second) across the sample, see Figure 3. By collecting the Raman scattered light at each position encountered by the laser, the resulting spectrum will be the total integrated response from all locations exposed to the laser. This spectrum will be representative of the sample. To demonstrate this, the spectrum of the average spectrum calculated from the multipoint measurement is compared to the VDPS Raman measurement in Figure 3. The VDPS and average spectrum are virtually identical.


How can Raman measurements be applied to gauge the efficacy of carbon nanotube separation methods?
The VDPS sampling method used and described above to obtain a sense of the quality of a collection of carbon nanotubes can be employed to guide synthetic production routes for carbon nanotubes or to gauge the effectiveness of separation protocols aimed at isolating particular types of carbon nanotubes.
During synthesis, both semiconducting and metallic single-walled nanotubes exist in the ratio 2 : 1, respectively. Semiconducting single-walled carbon nanotubes (s-SWCNTs) are desirable for technological applications including transistors, light-emitting diodes and photodetectors. The presence of even small quantities of metallic or multi-walled nanotubes severely degrades device performance. Therefore, separation of single-walled from multi-walled and semiconducting from metallic nanotubes is vital to achieving high-quality technologically relevant devices incorporating s-SWCNTs.
Previously, the polymer poly (9,9-dioctylfluorene) (PFO) has been shown to selectively wrap s-SWCNTs, which solubilises these specific nanotubes and allows them to be separated from multi-walled nanotubes, metallic single walled nanotubes and reaction catalyst.2 The absorption spectrum of the resulting solution may be used to obtain the chirality distribution in the extracted solution. Raman characterisation of separated s-SWCNT potentially offers an alternative method for determining separation efficacy.
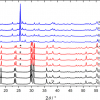
Films of nanotubes were prepared by dropcasting from solutions of raw CNT powder (Southwest Nanotechnologies, USA) (1 mg mL–1) and PFO (American Dye Source, Inc., USA) (2 mg mL–1) in toluene, and from a solution of PFO-separated s-SWCNT (<0.01 mg mL–1) and PFO (2 mg mL–1) in toluene onto quartz slides. Figure 4 shows VDPS Raman spectra of the raw mixture of carbon nanotubes and the PFO-separated CNTs. Each peak in the VDPS Raman spectrum represents a distinct diameter of carbon nanotubes. There are large differences between spectra of the raw and PFO-separated carbon nanotubes. From these spectra, it is evident that during the separation process, specific chiralities of carbon nanotubes are isolated from the raw mixture, which is an expected result of the PFO separation procedure.

Summary
In summary, Raman spectroscopy provides useful information when characterising a collection of carbon nanotubes when applied with care. It was demonstrated in this article that a representative spectrum could be obtained that gives insight into the quality, uniformity of the whole collection of tubes. Two sampling methods were discussed. Of the two methods, the VDPS method, or variable dynamic point sampling, was demonstrated to be much faster than and as representative as multipoint sampling. Finally, VDPS Raman spectra were used to compare a raw mixture of carbon nanotube species and an isolated batch of semiconducting carbon nanotubes, offering insight into the effectiveness of the separation method.
References
- M.A. Dresselhaus, G. Dresselhaus, R. Saito and A. Jorio, “Raman spectroscopy of carbon nanotubes”, Phys. Rep. 409, 47–99 (2004). doi: 10.1016/j.physrep.2004.10.006
- A. Nish, J. Hwang, J. Doig and R. Nicholas, “Highly selective dispersion of single-walled carbon nanotubes using aromatic polymers”, Nat. Nanotechnol. 2, 640–646 (2007). doi: 10.1038/nnano.2007.290


