Articles
A.M.C. Daviesa and Tom Fearnb
aNorwich Near Infrared Consultancy, 75 Intwood Road, Cringleford, Norwich NR4 6AA, UK. E-mail: [email protected]
bDepartment of Statistical Science, University College London, Gower Street, London WC1E 6BT, UK. E-mail: [email protected]
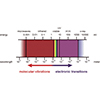
Since the first experiment was performed nearly a decade ago, ultrafast two-dimensional infrared (2D-IR) spectroscopy has emerged as an exciting non-linear ultrafast laser technique for probing molecular structure and solute–solvent interaction dynamics in a range of systems of chemical and biological relevance.
A.M.C. Davies and Tom Fearn
Norwich Near Infrared Consultancy, 75 Intwood Road, Cringleford, Norwich NR4 6AA, UK. E-mail: [email protected]
Department of Statistical Science, University College London, Gower Street, London WC1E 6BT, UK. E-mail: [email protected]
The starting point for this column is the last one from last year! In that column TD began what was intended to be a two-part story but has, with this column, become a story in four parts. There were required topics we had not covered and we need to begin this column by completing the discussion of removing multiplicative effects by describing what the two most popular methods do to NIR spectra.
Thin polymer layers on solid substrates are of high technological importance due to their increasing potential for applications in electronics, sensors, nanotechnology and biotechnology. Appropriate characterisation methods are necessary for the design and analysis of devices made using such materials. This review article focuses upon presenting the many analytical possibilities for quantitative evaluation of the optical constants and thickness of polymer layers by combined application of spectroscopic ellipsometry (SE) in the visible (vis) and infrared (IR) spectral range.
The last TD column showed the effect of calculating second derivatives on a set of 100 spectra, which will be the starting point for this column.
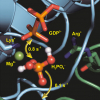
In the post-genome era, the focus of life science is shifting to proteins. Based on the difference between the various states of the protein, time resolved Fourier transform (tr-FT-IR) spectroscopy can selectively detect, with nanosecond resolution, reactions of the amino acids, the ligands and specific water molecules in the active centre of the protein, thereby providing a detailed understanding of the reaction mechanism. Malfunctioning of proteins is the cause of many diseases. Thus, the understanding of structure, function and interaction of proteins at the molecular level is essential for the development of drugs for a rational molecular therapy.
This column is about the most basic of pre-treatments, which has been used in spectroscopy well before the word "Chemometrics" was invented.
This article focusses on the application of near infrared (NIR) spectroscopy as a potential substitute to the sensory evaluation of tea quality.
The University of Leicester began an investigation to determine whether useful information on PAN (Peroxyacetyl nitrate) could be obtained from MIPAS data using the MSF absorption cross-sections.
The authors report on an analytical technique based on the combination of attenuated total reflection infrared (ATR-IR) spectroscopy and modulation excitation (ME), which enables the investigation of the interactions leading to separation at the selectand—selector interface.
Kevin M. Smith
Molecular Spectroscopy Facility, Space Science and Technology Department, CCLRC Rutherford Appleton Laboratory, Chilton, Didcot, Oxfordshire, OX11 0QX, United Kingdom
Andreas Richter
Institute of Environmental Physics, University of Bremen, Bremen, Germany. E-mail: [email protected]
Geoffrey Duxbury and Nigel Langford
Scottish Universities Physics Alliance, Department of Physics, John Anderson Building, University of Strathclyde, 107 Rottenrow East, Glasgow G4 0NG, UK. E-mail: [email protected], [email protected]
Erik Skibsted
Novo Nordisk, CMC Supply, Analytical Development, Denmark. E-mail: [email protected]
Gerard Downey,a* J. Daniel Kellya and Cristina Petisco Rodriguezb
aTeagasc, Ashtown Food Research Centre, Ashtown, Dublin 15, Ireland. E-mail: [email protected]
b Instituto de Recursos Naturales y Agrobiología, CSIC, Apdo 257, 37071 Salamanca, Spain
S. Benali,a D. Bertrand,b J. Dupuyc and G. Lachenald
aUniversité de Mons Hainaut, Matériaux Polymères et Composites, Place du Parc, 20 ,7000 Mons, Belgium
bENITIAA-INRA, Unité de Sensométrie et Chimiométrie, BP 82225, 44322 Nantes Cedex 03, France. E-mail: [email protected]
A.M.C. Davies
Norwich Near Infrared Consultancy, 75 Intwood Road, Cringleford, Norwich NR4 6AA, UK
Introduction
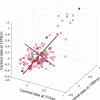
In my last column I began a revision of basic chemometrics.1 In this column I will discuss some interpretation of the results produced by principal component analysis (PCA) as part two of this revision programme.
Gerhard Litscher
Biomedical Engineering and Research in Anesthesia and Intensive Care Medicine, Medical University of Graz, Auenbruggerplatz 36, A-8036 Graz, Austria. E-mail: [email protected]; http://litscher.at; http://litscher.info
PCA is a mathematical method of reorganising information in a data set of samples. It can be used when the set contains information from only a few variables but it becomes more useful when there are large numbers of variables, as in spectroscopic data.


