Maarten Scholtes-Timmerman,a Cees Heddes,b Martijn Noortb and Sjaak van Veena
aTNO EELS, Research Group RAPID, Utrechtseweg 48, 3704HE Zeist, The Netherlands. E-mail: [email protected]
bTNO EELS, Research Group Functional Ingredients, Utrechtseweg 48, 3704HE Zeist, The Netherlands
Introduction
Salt, or more specifically, sodium (Na) is an important flavour-determining compound in bakery products. A large number of deaths can be related to the effects of too high a salt intake; in general, the intake of Na is much higher than advised. For example, the average adult daily intake of sodium chloride in 12 western European countries is 8–12 g1 whereas the recommended daily intake should to not exceed 6 g;2 the nutritionally required amount is only as high as 1–2 g a day.
Bread is the major contributor to Na intake in the human diet. For this reason, it is expected that lowering the amount of salt in bread may lead to a substantial reduction in the sodium intake. However, lowering the amount of salt in bread has an impact on the flavour.
Several approaches are being undertaken to achieve a lower salt concentration in bread without affecting the flavour of the final product. Recently, it was found that an inhomogeneous distribution of salt in bread could be used to enhance salt intensity, allowing for a reduction in salt without loss of salt intensity.3 Local concentrations of tastant appear to result in sensory contrast which leads to elevated taste perception compared to the same concentration of tastant distributed homogeneously throughout the food product. A subsequent study4 showed that a large enhancement of taste perception could be achieved by creating spots with a much higher level of sodium chloride, created by means of encapsulated salt particles. The actual salt distribution was found to be important, as a substantial salt concentration contrast is desired to enhance salt intensity perception, but when the contrast was too large, the product was disliked and no longer acceptable.
In semi-solid food products such as bread, cheese and meat, which have a moisture content of ~40% w/w, sodium dissolves in the aqueous phase and migrates relatively quickly, causing the initial salt concentration contrast to fade in time. To create a food product with the desired sodium distribution, there is need for a technique that enables efficient and accurate determination of the sodium distribution in the product.
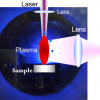
Laser-induced breakdown spectroscopy (LIBS) is a minimally destructive type of atomic emission spectroscopy that does not need any sample preparation [unlike alternative techniques such as scanning electron microscopy/energy-dispersive X-ray spectroscopy (SEM-EDX)] and will provide information on the local distribution of elements at relatively low cost. With LIBS, the sample is excited using a focused, short and high-power laser pulse, which leads to plasma generation, atomic excitation and, subsequently, emission of atomic lines at element-specific frequencies.
The current study outlined in this article aims at providing a proof-of-principle to use LIBS as an easy-to-use and fast tool to analyse spatial Na distribution in bread in which spots of higher salt concentration are present.
Materials and methods
Salt particles
Particles were made with the aim of creating small localised areas with a high salt concentration. Salt was included in particles with variable food grade ingredients.
Bread preparation
Standard bread (without salt spots) was made using a standard recipe and consisted of approximately 500 g of Edelweiss flour (Meneba, Rotterdam, The Netherlands), 290 mL of tap water, 15 g of Prestant White bread improver (Zeelandia, Zierikzee, The Netherlands), 8.3 g of Fermipan Red instant yeast (AB Mauri, Moerdijk, The Netherlands) and variable amounts of Suprasel baker’s salt (Akzo Nobel Functional Chemicals, Hengelo, The Netherlands). The amount of salt added was 0, 0.5, 1, 2, 4, 10, 15 and 20 g corresponding to 0, 0.25, 0.5, 1.0, 2.0, 5.0, 7.5 and 10.0% salt on the flour base. Dough was mixed in a spiral mixer and was allowed to rise for 30 min. The dough was moulded and put into tins and left to rise for 1 h at 30°C / 95%RH. Subsequently, the breads were baked for 30 min in a rotating oven at 240°C. After cooling for 1 h, the bread was frozen to –30°C in 1 h and subsequently stored at –20°C until use.
Bread with salt spots
Bread with added salt spots was made using the same recipe as for the standard bread, but in which the added salt was replaced by salt containing particles. The amount of salt containing particles was calculated to correspond to 1% salt on the flour base. Red food colourant was included in the particles to assist as a visual marker for the presence of a particle in the baked bread product.
LIBS
LIBS spectra were recorded using a four-channel spectrometer, AvaLIBS-100 system (Avantes BV, Apeldoorn, The Netherlands), controlled using LIBSoft 4.0 measurement and control software (Applied Photonics, Skipton, United Kingdom). Excitation was carried out using a Q-switched Nd:YAG-laser (1064 nm), with a pulse length of 7 ns, pulse delay 134 µs, 100 mJ / pulse and an exposure time of 1.3 ms / pulse. Spectra were recorded using a 10 Hz repetition rate.
Emission spectra were recorded in the range 237.223 nm to 1010.679 nm (4096 channels), giving an approximate resolution of 0.2 nm.
Analysis
All spectra were analysed using MATLAB 7.5 (R2007b, The Mathworks, Natick, MA, USA). The summed channels for 587.988 nm to 591.075 nm (28 channels) were used as a measure for the emission signal of sodium and the summed channels for 764.840 nm to 768.115 nm (19 channels) were used as a measure for the emission signal of potassium.
Bread sampling
Bread samples were created by thawing the bread at 20°C. A 4 cm diameter, 1 cm high disc was cut out of a slice of bread using a sharp metal cylinder. It was compressed by application of 200 N force for 16 s using a texture analyser with a probe fitting accurately in the metal cylinder. By this means, bread was compacted to ~2 mm disks with a relatively flat surface.
Calibration
In order to relate sodium profiles to actual mass percentages of Na in dry flour in the case of salt-rich spots, a calibration equation was generated. This was done by measuring standard samples (without hotspots, with Na homogeneously distributed) with 0, 0.25, 0.5, 1.0, 2.0, 5.0, 7.5 and 10.0 mass% Na in dry flour. Samples were measured in triplicate, using a line scan of 20 different locations and 10 excitations per location.
Samples with high-salt containing spots
Slices were cut from the bread with salt spots which were used to perform LIBS line scans using a manual translation stage with steps of ~0.7 mm between locations (Figure 1). 50–60 locations were measured per sample, depending on the exact location of the NaCl spot, alongside the shortest dimension of the spot. Per location, ten individual spectra were accumulated. Per type of bread, three samples were measured. Using the previously measured calibration line, the calculated mass% Na in dry flour was calculated as a function of the x position of the translation stage.
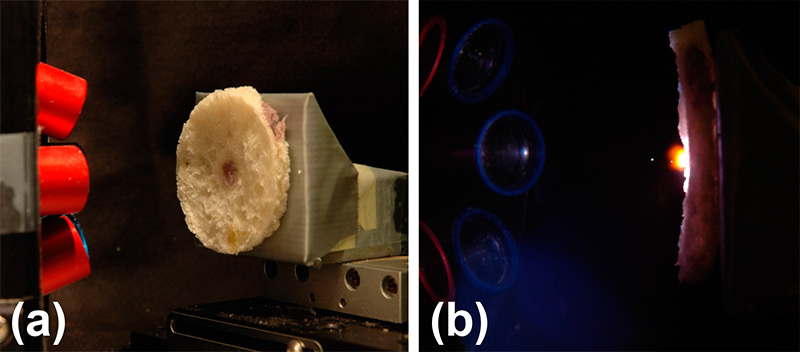
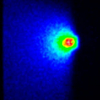
Figure 1. (a) Bread sample with salt-rich region, indicated by the purple colour in the centre. (b) Photo taken peripendicular to the bread sample, showing the laser-induced plasma plume.
Results
Figure 2 shows a typical example of a LIBS spectrum, with the Na- and K-specific regions indicated in the scale-expanded insets.
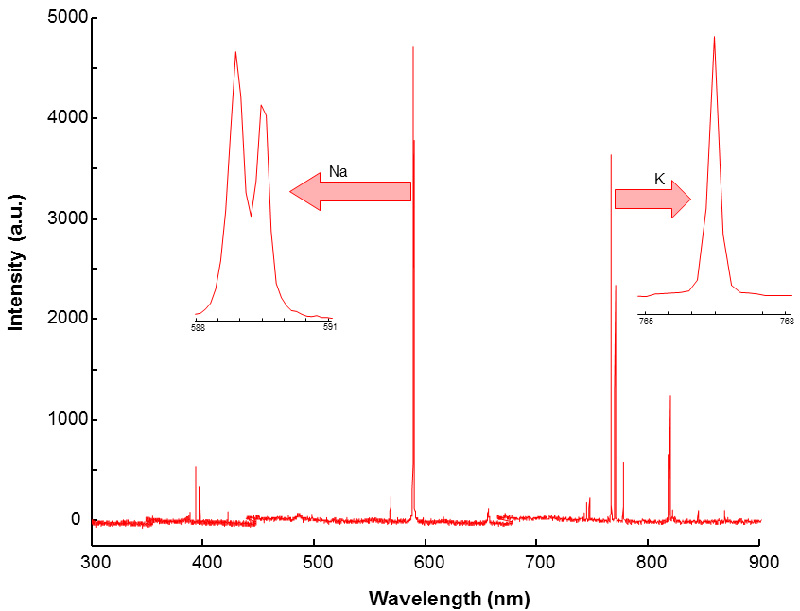
Figure 2. Typical LIBS spectrum of bread. The insets show the relevant spectral regions for sodium and potassium.
Calibration line
It was found that the reproducibility of the Na emission is low. It is estimated that this is due to the plasma formation being hindered by water shielding and heat dissipation5 and, as bread contains up to 40 mass% water, LIBS emission intensity is likely to vary greatly between repeats. It was therefore decided to use the Na emission intensity, normalised to the K emission intensity, as a measure for the actual Na presence. The rationale behind this step is that the K signal also varies as a result of water presence, but the overall K distribution over the bread samples is deemed constant.
It was found that reproducibility increased significantly using the Na / K emission ratio rather than the Na emission only.
Using a linear fitting algorithm, the calibration line expressing the Na / K emission ratio (see Figure 3), as a function of mass% Na in dry flour, can be expressed as: y = 0.6649x + 1.0264 where y represents the Na / K LIBS peak integral ratios, and x represents the mass percentage of NaCl, on the basis of dry flour content of the bread.
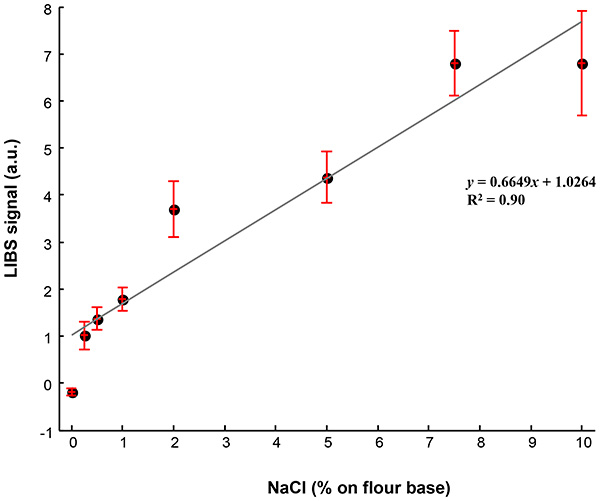
Figure 3. Calibration line showing the relationship between the LIBS Na/K peak integral ratio as a function of NaCl content on dry flour base. The error bars represent the errors from triplicate experiments.
Bread samples of different age
To estimate how the Na content changes due to the hygroscopic nature of salt, bread samples of different age (zero days, one day and four days) were analysed. Figure 4 shows a typical Na distribution, as calculated using the above-mentioned calibration line, for a sample at different ages.
It can be seen quite clearly that, over time, the peak amount of Na in the hotspots decreases while the Na washes out into the surroundings.
The analysis time is very short; in practice, one sample of bread containing 60 LIBS different specific locations on a line could be measured within 5 min.
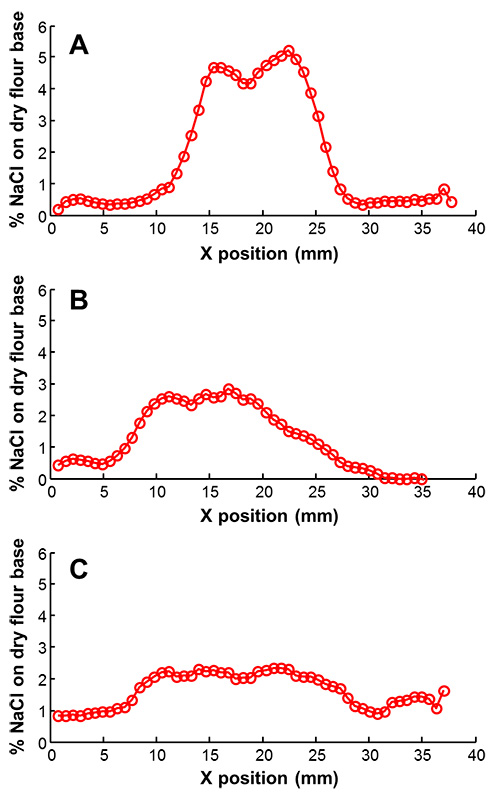
Figure 4. Measured NaCl gradients for bread of zero days, one day and four days old [(a), (b) and (c), respectively].
Conclusion
Using LIBS, a fast and easy-to-use method could be set up to determine Na distribution in baked bread as an innovative tool to help the development of methods to reduce total sodium content in bread.
References
- “Opinion of the Scientific Panel on Dietetic Products, Nutrition and Allergies on a request from the Commission related to the Tolerable Upper Intake Level of Sodium”, The EFSA Journal 209, 1 (2005).
- Health Council of the Netherlands, in Guidelines for a healthy diet 2006. Health Council of the Netherlands (The Hague), publication no. 2006/21 (2006).
- M.W.J. Noort, J.H.F. Bult, M. Stieger and R.J. Hamer, J. Cereal Sci. 52(3), 378 (2010). doi: 10.1016/j.jcs.2010.06.018. https://doi.org/10.1016/j.jcs.2010.06.018
- M.W.J. Noort, J.H.F. Bult and M. Stieger, J. Cereal Sci. 55(2), 218 (2012). doi: 10.1016/j.jcs.2011.11.012. https://doi.org/10.1016/j.jcs.2011.11.012
- J.P. Singh and S.N. Thakur (Eds), Laser-Induced Breakdown Spectroscopy, 1st Edition. Elsevier Publishing, Amsterdam, The Netherlands (2007).


