

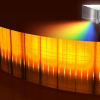
Interpreting mass spectrometry imaging (MSI) data is a challenge. One can start by imaging the distribution of molecules over the tissue section surface and creating a full-colour image where each colour represents points with similar ion composition. So, thousands of ions with corresponding intensities at each point are represented by just three numerical values that reflect the MSI data and are correlated with a 3D colour space to enable further analysis by a researcher.
“It is essential to glean as much information from the image as possible, taking into account the genuine features of human vision, such as non-linearity and essentially different sensitivity to changes in brightness and colour. Although the theory of colour perception has been studied since the first half of the 20th century, experts still lack commonly accepted mathematical models accurately explaining all the known properties of human vision”, Anastasia Sarycheva, the lead author and a Skoltech PhD student, explains.
A new MSI approach has been proposed leveraging the theory of human colour perception and comparable to the existing techniques in the level of detail. The new method preserves borders and gradients when superposing regions of similar ion composition. Thus, the resulting image is more interpretable than in other MSI visualisation techniques. The method has been tested on both simulated and experimental data obtained by researchers from the Skoltech Mass Spectrometry Laboratory jointly with biologists from the Skoltech Center for Neurobiology and Brain Restoration.


 and tower-based instruments (B and D) for control (blue) and drought (red) treatments. Credit: Christopher YS Wong et al. from University of California, Davis")
 and Leon Gläser (right) from the ZSW in Ulm together with WITec Application Scientist Dr Ievgeniia Iermak (middle) during training on the new Raman microscope.")