
Jacques Thierie
ULB-Retired, Faculté des Sciences, Bruxelles, Belgium. E-mail: [email protected]
Unstable suspensions of microorganisms (AS, activated sludge) produced by biological treatment plants sediment in an unusual and very specific mode: hindered settling. We use an optoelectronic assembly operational at 940 nm (in the short wavelength near infrared) to study the kinetics of this settling. Amazingly, we discover that, transiently, the AS transmission can exceed 100 % compared to pure water. We hypothesise that the “optical structure” of water can be modified in this mixture, which contains numerous biological macromolecules. We locate our working wavelength on the water spectrum, close to the O–H stretching overtone. In addition, as an example, we show how this property could be used to improve the prediction and thus the management.
Introduction
Wastewater treatment is an important environmental obligation. Among the many processes used to date, biological purification remains the most common. The principle of the process is to separate the wastewater into two phases. One is “liquid” and is released into the environment (clarified water); the other is “solid” and composed mainly of microorganisms (bacteria), which have absorbed or metabolised certain pollutants. This solid phase is called “activated sludge” (AS).
It will be readily understood that the success of a biological treatment lies in the good separation of the two phases. The specific weight of AS is generally slightly higher than that of water, so the simplest and most commonly employed separation process is to allow the solid phase to settle (or sediment) under the action of gravity.
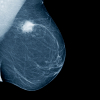
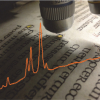
Sedimentation of AS occurs by a very specific process, rarely observed for other compounds, known as hindered settling. Hindered settling is characterised by a very flat and well-defined solid–liquid interface, almost exactly parallel to the air–water interface, as shown in Figure 1.
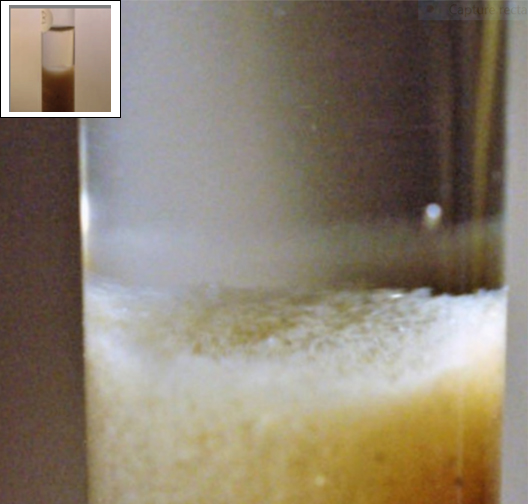
Figure 1. The box at the top-left clearly shows the sharp interface between solid (opaque) and liquid (transparent) phases characterising a hindered settling. The main picture shows the same interface surmounted by a more diffuse “ring” (which we call an “aura”).
Given the environmental and economic importance of water purification and biological wastewater treatment plants (WWTP), we have developed a small, simple and inexpensive optoelectronic device, which we call ASAN (Activated Sludge Analyser), originally intended for study the AS sedimentation.
Material and methods
The ASAN device is shown in Figures 2 and 3. (Figure 4 shows the device used to hold the optical glass tube vertically.) The optical axis connects a LED emitting at 940 nm (short wavelength near infrared, SWNIR). The light beam passes through an optical glass tube ½ inch in diameter and strikes a phototransistor sensitive to this wavelength. The whole is powered by a steady DC current. The current emitted by the phototransistor is transmitted to a data logger and the data, in µA (I) and seconds (t), are sent to a PC (using a CSV file). We define transparency, TY%, by
\[TY\% = \frac{{I - {I_b}}}{{{I_0} - {I_b}}} \times 100\]
(1)
where I0 is the intensity of the blank (distilled water, filtered at 0.2 µm and thus made virtually sterile), Ib is the residual intensity (dark current), obtained by cutting the power supply (Ib << I; » 0), I is the measured intensity. The time interval, Δt, is constant and chosen on the data logger.
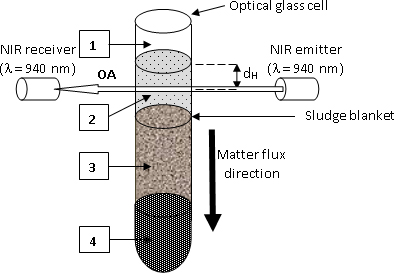
Figure 2. Sketch of the ASAN device. 1: air; 2: liquid phase; 3: settling solid phase (AS); 4: compacted AS. Reprinted by permission of SAGE Publications.
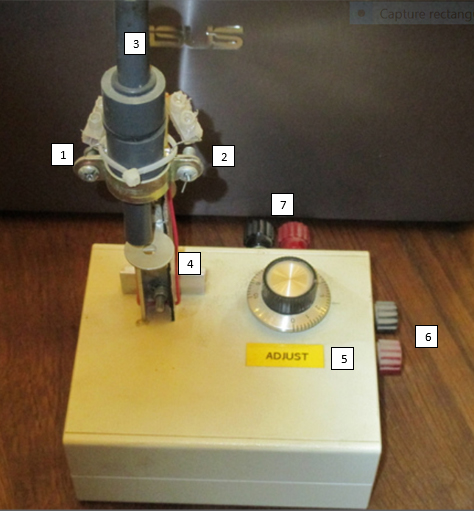
Figure 3. General view of the ASAN unit prototype. 1: phototransistor (receiver); 2: 940 nm LED (emitter); 3: optical glass tube location (here, replaced by PVC rod to protect the optoelectronics); 4: tube height adjustment system; 5: 100 % adjustment potentiometer; 6: during current input (power is off to check the 0 % of the unit); 7: output to datalogger.
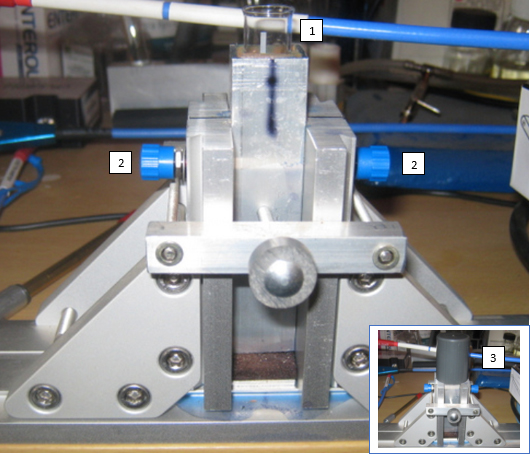
Figure 4. General view of the vertical tube holder. 1: optical glass tube Ø ½ inch; 2: nozzle for optical fibre SMA-905 connector (with collimating lens); 3: tube covered by thick grey PVC lid.
Results
Figure 5 shows a set of results obtained via the ASAN device, according to various types of AS, WWTP, sampling points, concentrations etc. The study of the general profile is described in References 1–3 and we will here only consider the most striking characteristic: some maxima of transparency exceed 100 % (Figure 5). Figure 6 isolates two of these curves and better highlights the phenomenon. After a noisy, but relatively constant, period [corresponding to the downward movement of the solid phase (the AS)], the transparency increases sharply and is a good indicator of the solid–liquid transition of the settling mixture interface crossing the optical axis. After this abrupt transition step, a maximum value usually occurs; in most cases, this “mini-maximum” remains less than 100 %. However, in a number of situations, the transparency exceeds 100 %, which seems, a priori, impossible given the technique and relation.1 It must be concluded that this fraction of AS is transiently more transparent than distilled water filtered at 0.2 µm (“sterile”, therefore). This is obviously counterintuitive and can only be explained if the solvent of the liquid phase is no longer ordinary water, and thus not comparable to the blank used to calibrate the ASAN. This observation is confirmed by the appearance of an “aura” (circular ring of matter, directly over the sedimentation mass of the AS. The phenomenon is clearly visible in Figure 1; this zone corresponds to an exclusion zone water (EZ water) according to Professor G. Pollack (personal communication) and a more crystalline form of liquid water.
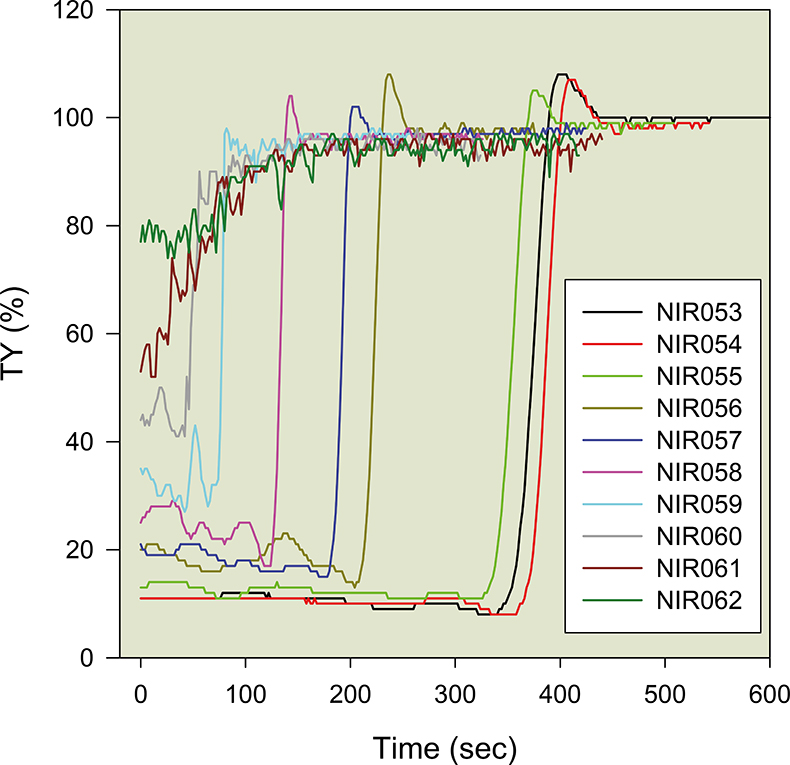
Figure 5. Various types of AS settling profiles obtained via the ASAN method. Hundreds of such curves have been studied (NIR0xx are experiment numbers).
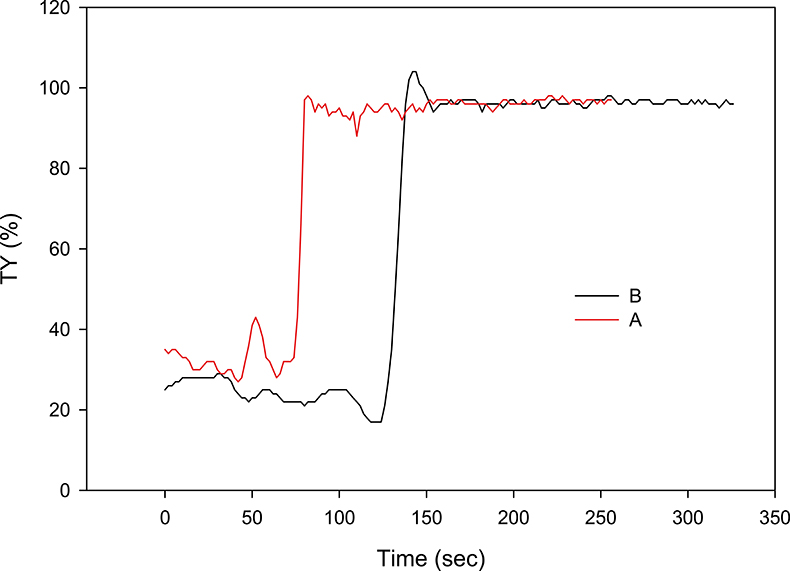
Figure 6. Two separated profiles of the Figure 5 series. Curve A shows a slight maximum just after the sudden rise in TY%, but it does not reach 100 %; curve B, on the contrary, significantly exceeds 100 %. After the maximum transient states, the two curves overlap and give an identical average value (greater than 95 % transparency) of the settled water.
These observations in the SWNIR allow us to highlight exciting and unexpected phenomena, but they are also exploitable in R&D.
The asymptotic values for t → ∞ of Figures 5 and 6 (and in general), tend to TY% < 100 %, suggesting that the “clarified” water still contains suspended particles. The microorganisms forming the AS produce a significant amount of extra-polymeric substances (EPS) that can, along with other non-biodegradable pollutants, go through the treatment plant and be released into the environment. These ESS (effluent suspended solids) obviously should be avoided as much as possible (both for economic and health reasons). We have highlighted (see Figure 7) that a correlation between ESS and AS characterised by a maximum of the settling profile exceeding 100 % could be established. This could provide a predictive tool to reduce ESS (via the addition of flocculants, management adjustment of the plant etc.). The data are unfortunately still insufficient to validate this correlation and the concluding form of the relationship.
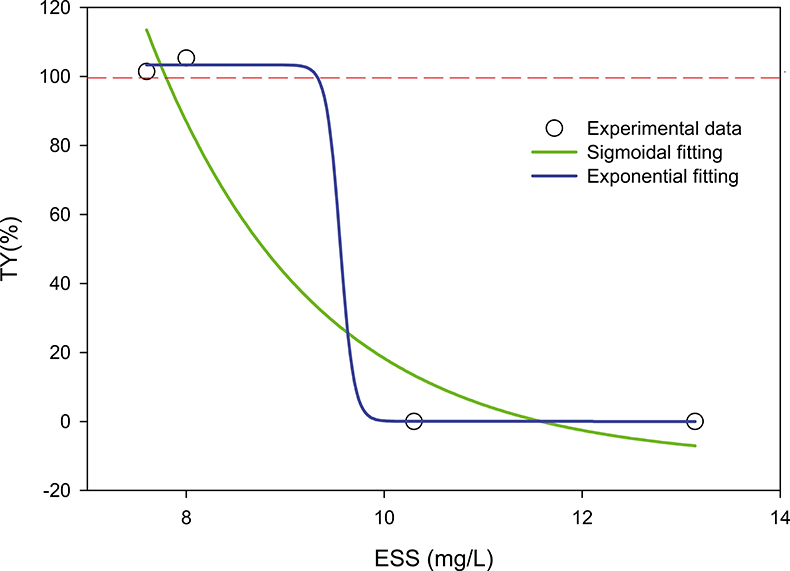
Figure 7. The figure shows a still hypothetical relation between AS with maximum transparency greater than 100 % (TY% > 100) and suspended solids in the effluent of a biological treatment plant. If the sigmoid model is confirmed, one could predict that for max (TY%) > 100 %, ESS < 10 mg L–1; max (TY%) < 100 %, ESS > 10 mg L–1. (Correlation coefficients of fittings: exponential, r = 0.97, sigmoid, r = 0.99.)
Discussion
The results described above are thought-provoking and remain unexplained, from our point of view. It is obvious that more research is needed.
As discussed above, and after eliminating a possible artefact from the device through the reproduction of hundreds of experiments, our main hypothesis is the possibility of a modification of the “optical structure” of the water, observable in the SWNIR. So, we decided to locate our working position at 940 nm on the water spectrum. Figure 8 shows the result obtained via an optical fibre Vis-NIR spectrometer.
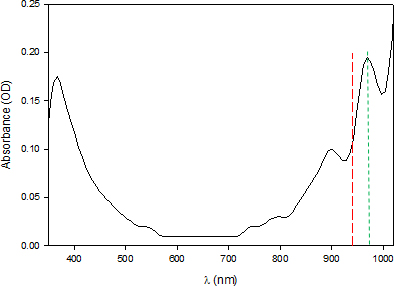
Figure 8. This shows the spectrum of liquid water between 350 nm and 1050 nm. It was obtained with a Flame NIR (Ocean Optics) fibre optic spectrometer, at ordinary temperature, on filtered distilled water and air as white (empty glass tube). The raw result was very noisy and was therefore smoothed by the bisquare method (using a degree 2 polynomial). In the SWNIR, we observe two absorption peaks at λ1 = 898.9 ± 4.2 nm and λ2 = 966.3 ± 1.3 nm (green line). Our working wavelength is represented by the red line at 940 nm.
Two arguments lead us to consider that the observed value of 966.3 nm is more relevant for our study: the peak is closest to our working wavelength and its absorption is twice as high as the preceding one and therefore more likely to be more sensitive to variation in transparency. However, these are currently only hypotheses to be tested.
Let us admit, however, that we are working toward 966.3 nm ≈ 970 nm. This value would correspond to the second overtone of the stretching band of the O–H bond (probably 2ν1 + ν3). The number of possible hypotheses then becomes considerable: from G. Pollack’s liquid crystal water (associated with the aura of Figure 1, EZ zone), to more complex structures [such as “Hexamer (Cage), Liquid Surface, Liquid and Ice”, which evoke “the extent of correlation between frequency and molecular environment in the liquid”].4
The proximity of many bio-macromolecules (EPS, cells walls and others) does not mask at all the peak at 970 nm (“these studies have reported peak absorption around 970 nm and 1180 nm in normal arterial tissue”)5 and, presumably, participate in the structuring of water.
We cannot push the speculation further before continuing the experimental aspect of our research... which for a retired researcher, with little money and dropped by his academic structure requires a lot of effort and time. I would like to take this opportunity to ask readers who may be interested in collaboration or who may have ideas to explain the phenomenon described in this article to contact me.
Readers are also encouraged to use the commenting facility in the online edition to discuss any points that may arise from this article. You need to be logged in to comment, and you will find the comment form at the end of the article—Ed.
References
- J. Thierie, “Near-infrared dynamic measurements of activated sludge highlight the possibility of the local modification of free water properties”, J. Near Infrared Spectrosc. 20, 415–418 (2012). doi: https://doi.org/10.1255/jnirs.991
- J. Thierie, “NIR observation of activated sludge decantation indicates correlation with the effluent suspended solids of four different wastewater treatment plant situations”, Microb. Biochem. Technol. 5, 130–135 (2013). doi: https://doi.org/10.4172/1948-5948.1000111
- J. Thierie, NIR Activated Sludge Settling Measurements for Monitoring Effluent Suspended Solids. Poster presented at the First Symposium on Aquaphotomics in Brussels, 14 October 2014.
- C.J. Tainter, Y. Ni, L. Shi and J.L. Skinner, “Hydrogen Bonding and OH-Stretch Spectroscopy in Water: Hexamer (Cage), Liquid Surface, Liquid, and Ice”, J. Phys. Chem. Lett. 4(1), 12–17 (2013). doi: https://doi.org/10.1021/jz301780k
- T.J. Allen, P.C. Beard, A. Hall, A.P. Dhillon and J.S. Owen, “Spectroscopic photoacoustic imaging of lipid-rich plaques in the human aorta in the 740 to 1400 nm wavelength range”, J. Biomed. Optics 17(6), 061209 (2012). doi: https://doi.org/10.1117/1.JBO.17.6.061209
General literature
- J. Wingender, T.R. Neu and H.-C. Flemming (Eds), Microbial Extracellular Polymeric Substances – Characterization, Structure, and Function. Springer-Verlag, Berlin, Heidelberg, New York (1999).
- Metcalf & Eddy, Inc., Revised by G. Tchobanoglous and F.L. Burton, Wastewater Engineering – Treatment Disposal Reuse, 3rd Edn. McGraw-Hill, New York (1991).


Comment posted on behalf of Dr William Croydon:
The article says nothing about the spectral bandwidth of the LED, the diameter or collimation of the light beam, all of which could influence the >100% transmission found.
Assuming standard optical fibre connectors are used, the beam diameter will probably be a few mm, and the collimation limited to several degrees. I would think it quite likely that light which would not enter the detector in pure water could be scattered/reflected from the surface of the 'solid' phase and enter the detector, in addition to that directly transmitted through the 'transparent' phase. This could give an apparent transmission >100% immediately after the interface has passed below the direct optical path.
I would suggest that this could be investigated by designing a more stringent collimation system for the optical beam.
An alternative, which I think less likely, is that if there is an 'exclusion zone' water with increased crystallinity this could change the wavelength of the absorption peak, with consequent changes in optical absorption at a fixed wavelength on the side of the peak, as used in this investigation.
I trust these thoughts will be of interest to the authors.