Ewa Sikorskaa* and Igor Khmelinskiib
aFaculty of Commodity Science, Poznań University of Economics and Business, al. Niepodległości 10, 61-875 Poznań Poland. E-mail: [email protected]
bUniversidade do Algarve, FCT, DQF and CIQA, Campus de Gambelas, Faro 8005-139, Portugal
Introduction
Fluorescence spectroscopy is a well-established research and analytical technique used extensively in many disciplines. Fluorescence is a type of photoluminescence; a process in which a molecule, raised to an electronically excited state by absorption of ultraviolet (UV) or visible radiation, decays back to its ground state by emission of a photon with energy different from that absorbed. It involves transition between the excited and ground electronic states of the same multiplicity, usually S1→S0, occurring at relatively high rates, typically 108 s–1.
The main advantages of fluorescence over absorption spectroscopic techniques are its higher sensitivity and selectivity. Light emitted by fluorescence is detected against a low background, making fluorescence spectroscopy a much more sensitive technique than the absorption techniques, and one which is capable of even determining concentrations down to parts per billion levels.
A unique feature of fluorescence, distinguishing it from other spectroscopic techniques, is its inherently multidimensional character. Fluorescent properties of every compound are characterised by two basic types of spectra: excitation and emission, while not all of the absorbing molecules are fluorescent. These features contribute to higher selectivity of fluorescence as opposed to absorption spectra.
In recent decades, a remarkable growth in the use of fluorescence in food studies has been observed. Characteristic autofluorescence landscapes of products coupled with chemometric methods are used as fingerprints in non-targeted food analysis. In this article the applications of fluorescence spectroscopy to qualitative and quantitative analysis of foods are briefly reviewed.
Early studies of food fluorescence
The term “fluorescence” was introduced by Sir George Gabriel Stokes, physicist and professor of mathematics at Cambridge University, who in his paper entitled “On the Refrangibility of Light” described in 1852 the phenomena he called dispersive reflection, concluding that the wavelengths of the dispersed light are always longer than the wavelength of the original light. One of Stokes’ famous experiments involved the study of emission from quinine. A quinine solution when illuminated with the visible part of sunlight dispersed by a prism remained transparent. However, when the quinine solution was placed beyond the blue part of the sunlight spectrum (corresponding to the UV region), the solution glowed with blue light.1
Quinine is an alkaloid, found naturally in the bark of the cinchona tree, widely known at that time as a treatment for malaria. Interestingly, a few years after Stokes’ discovery, Mr Erasmus Bond used quinine as an ingredient of Quinine Tonic Water, which he produced and patented in 1858. In this way quinine turned out to be one of the first food components in which fluorescence was studied scientifically. Nowadays, fluorometric determination of quinine in tonic water is a widely used laboratory experiment, teaching undergraduate students the basics of fluorimetry, see Figure 1.

Figure 1. Tonic water illuminated with visible light (left) and a UV lamp (right). The glowing blue colour is due to the fluorescence of quinine.
Since the Hg lamp with the Wood’s filter became commercially available in 1925, visual observation of food fluorescence induced by UV light has been utilised in assessing food quality. The use of Wood’s lamp was accepted as the US official method for detection of olive oil adulteration. This method used characteristic chlorophyll fluorescence present in extra virgin olive oil, detecting adulteration with refined oils even then at the level of 5%.2
The monograph Fluorescence Analysis in Ultra-violet Light published in 1959 reviewed the application of fluorescence for the analysis of a variety of food products, based on more than 400 references published since 1911.3
The improvements in both spectroscopic instruments and computers contributed to the development of applications of fluorescence spectroscopy to food analysis over the following decades. Intensive progress in this area started from the 1980s, when the first applications of multivariate data analysis methods for the analyses were reported.4
Recording fluorescence fingerprints of foods
Fluorescence may be measured directly on the samples, using right-angle geometries for diluted solutions with low optical densities, or using front-face illumination for opaque samples.5
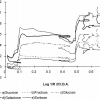
Food samples are complex systems; therefore, conventional single emission or excitation spectra are often insufficient to fully characterise their fluorescent patterns. In such cases, multidimensional measurement techniques are used, see Figure 2.

Figure 2. The different fluorescence spectra used as food fingerprints. Spectra of extra virgin olive oils are shown as an example from Reference 2 (Copyright E. Sikorska).
In a system containing several fluorophores, the emission spectra depend on the particular excitation wavelength used for the measurements. Thus, to obtain comprehensive fluorescence characteristics, a set of emission spectra over the range of excitation wavelengths is recorded. The resulting excitation–emission matrix, known also as the total fluorescence spectrum or the fluorescence landscape, provides comprehensive information of the fluorophores in the system, being a unique fingerprint of the sample studied.
Alternatively, food may be investigated by synchronous scanning fluorescence measurements, involving simultaneous scanning of both excitation and emission wavelengths, with a constant difference (Δλ) between them. This technique is very useful for the analysis of multi-fluorophoric systems, because both excitation and emission characteristics are included into a single synchronous fluorescence spectrum. The main advantages of synchronous fluorescence spectra as compared to total fluorescence spectra are their improved selectivity and sensitivity, significant reduction in the spectral complexity and suppressed light-scattering interferences.6
The main characteristics of the synchronous fluorescence spectrum are determined by the Δλ value. A set of synchronous spectra recorded at different wavelength intervals may be concatenated into a total synchronous fluorescence spectrum. In such, spectra fluorescence intensity is usually plotted as a function of the excitation wavelength and the wavelength interval. The relations between various kinds of fluorescence spectra of a virgin olive oil are presented in Figure 2.
Multivariate data analyses of fluorescence fingerprints
Multivariate data analysis methods are used to extract quantitative and qualitative information from the spectra. Analysis of a set of conventional emission, excitation or single-offset synchronous spectra arranged into a matrix usually starts with data exploration. This analysis does not require any prior knowledge of the explored data, being aimed at finding any patterns and trends in the sample set, and detecting outlying samples. The most commonly used method for data exploration is principal component analysis (PCA).
A calibration consists of building a relationship between the desired property of a sample and its fluorescence spectrum. The advantage of such an approach is the replacement of wet chemical measurements, which are usually slow and expensive, by non-destructive and fast spectral measurements.
The analytical problem for food quality assessment often involves assignment of a particular product to a specific category or discrimination between products from different categories. To perform such an analysis, supervised pattern recognition classification or discrimination methods are used, including the linear discriminate analysis, k-nearest neighbours, discriminate partial least squares regression, soft independent modelling of class analogy and artificial neural networks.
The multivariate regression methods most frequently used in fluorescence analysis are partial least-squares regression (PLS) and principal component regression (PCR).
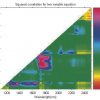
Multi-way methods are used for the analysis of sets of excitation–emission fluorescence matrices, see schematic in Figure 3.

Figure 3. Schematic of the analysis of the excitation–emission fluorescence matrices by multi-way methods.
One of these, parallel factor analysis (PARAFAC) is used to decompose the fluorescence data into a number of components corresponding to the distinct fluorophores present in the samples.4 This analysis provides estimates of the relative concentrations of each of the fluorophores and their respective excitation and emission profiles, facilitating identification of the fluorescent constituents. This approach, called mathematical chromatography, enables qualitative and quantitative analysis of the individual mixture components. N-way partial least-squares method (N-PLS) is used for the regression analysis of excitation–emission matrices.
Alternatively, excitation–emission matrices may be unfolded by arranging the data into two-dimensional matrices, and analysed using common multivariate methods.
Applications of fluorescence in food analysis
Fluorescence is usually observed in organic aromatic compounds with conjugated double bonds and rigid molecular skeletons. Note that the major food components are usually non-fluorescent. In contrast, many minor food components that affect its nutritive, compositional and technological quality are fluorescent. Food-relevant fluorescent compounds include aromatic amino acids, vitamins and cofactors, nucleic acids, porphyrins, polyphenols and alkaloids.
Note too that some products of food oxidation or deterioration also exhibit fluorescence. Fluorophores in foods also include process-derived compounds. Additionally, some food contaminants such as myco- and aflatoxins equally exhibit fluorescence. Therefore, fluorescence may be used to analyse all of these aspects of food quality.
The range of quality aspects of the food products studied by fluorescence-chemometrics is quite wide, including the application of both classification and regression methods. Fluorescence coupled with multivariate regression data analysis has been used for quantitative determination of chemical, physical and sensory food properties. Fluorescent techniques coupled with multivariate classification methods have been exploited to classify or discriminate foods according to different criteria. An important application is the assessment of food authenticity and adulteration, and discriminating between foods of different geographical origin or denominations of origin. In fact, fluorescence has become an analytical tool for process control in the food industry.
For example, edible oils contain fluorescent tocopherols, phenolic compounds and pigments of the chlorophyll group, along with oxidation and process-derived products that may contribute to their fluorescence.2 Important applications for fluorescence in edible oils studies include: authentication of virgin olive oils, discrimination between their different quality grades and geographical origins, and detection of adulteration with low-grade olive oils or other vegetable oils. Oxidation of olive oil, its quality changes during storage, and the interaction between plastic food packaging and olive oil have also been studied using fluorescence. Minor component of oils, such as tocopherols and chlorophylls, were quantified using fluorescence.
Dairy products contain several intrinsic fluorophores, including aromatic amino acids and nucleic acids, aromatic amino acids in proteins, vitamins A and B2, nicotinamide adenine dinucleotide, chlorophyll and fluorescent oxidation and process-derived products.3 Fluorescence of tryptophan was investigated in dairy products, as an indicator of the protein structure. Fluorescence was used for discrimination of the cheese types, ripening stages and geographic origins. Fluorescence correlated with the rheological characteristics of various cheeses. Intrinsic milk fluorescence was used to evaluate the heat treatment of milk. Riboflavin fluorescence was used as a marker of photo-oxidation due to light-induced changes in cheeses and yogurts. Fluorescence coupled with multivariate regression enables quantification of riboflavin in yogurts.4
Meat and fish autofluorescence originates mainly from collagen, adipose tissues, proteins and oxidation products.5 Fluorescence of collagen in meat has been used for quantification of connective tissue and collagen, and correlated with tensile properties, tenderness and water-holding capacity. Fluorescence of oxidation products correlated with lipid oxidation and rancidity of meats. Fluorescence of dietary porphyrins was suggested as an indicator of faecal contamination of meats.
Fish fluorescence was proposed as a method for detecting bones in fish fillets and assessment of fish freshness. Fluorescence of fish oil was suggested as a screening method for dioxin contamination.
Cereals and cereal products fluoresce due to aromatic amino acids, ferulic acid and riboflavin.4 Fluorescence was used for monitoring wheat flour refinement and milling efficiency and for classification of wheat cultivars.
Fluorescence of alcoholic drinks is attributed to several fluorophores. Brandies and whiskies fluoresce due to caramel, coumarins, tannins and other fluorescent compounds originating from wooden casks.7 Fluorescence combined with absorption spectroscopy revealed grouping of single-malt whiskies according to their geographic area of production. Beer autofluorescence originates from aromatic amino acids, polyphenols and B group vitamins; contribution of the bitter acids was also suggested, but not fully confirmed.4 Fluorescence was proposed for monitoring bitterness and determining the aromatic amino acids and riboflavin content in beer. Wine fluorescence shows contribution from polyphenolic compounds. It allows classification of wines according to variety, typicality and manufacturer. Recently, quantification of several phenolic compounds using wine fluorescence was also reported.
In fruit and vegetables, chlorophyll fluorescence was used as an important indicator for their quality during harvesting and post-harvesting periods.
Sucrose itself is not fluorescent, thus the fluorescence of the impurities was utilised in the analyses of sugar and sugar solutions. In particular, the fluorescent signals of the aromatic amino acids tyrosine and tryptophan and colorant polymers formed in Maillard reactions during the sugar processing were identified.4 The classification according to production site and correlations to important sugar quality parameters were demonstrated by directly measuring fluorescence of crystalline samples.
Conclusions
One of the most important features of the fluorescence, common also to the other spectroscopic fingerprinting techniques from the practical perspective, is its ease of use and simplicity. Different chemical components or properties of the sample may be determined from a single spectral measurement. The non-destructive fluorescent measurements are performed directly on the untreated samples, thus avoiding time- and labour-consuming chemical treatment steps and fulfilling the requirements for green chemistry.
Fluorescence, characterised by its high sensitivity and selectivity and multidimensional character, may be superior or at least complementary to the absorption spectroscopy fingerprinting techniques in many practical applications, and also in the fundamental research of food systems.
References
- B. Valeur and M.N. Berberan-Santos, “A brief history of fluorescence and phosphorescence before the emergence of quantum theory”, J. Chem. Educ.88, 731 (2011). doi: http://dx.doi.org/10.1021/ed100182h
- E. Sikorska, I. Khmelinskii and M. Sikorski, “Analysis of olive oils by fluorescence spectroscopy: methods and applications”, in Olive Oil-Constituents, Quality, Health Properties and Bioconversions, Ed by D. Boskou, InTech, p. 63 (2012). doi: http://dx.doi.org/10.5772/30676
- J.A. Radley and J. Grant, Fluorescence Analysis in Ultra-violet Light. Chapman & Hall, London (1959).
- J. Christensen, L. Nørgaard, R. Bro and S.B. Engelsen, “Multivariate autofluorescence of intact food systems”, Chem. Rev. 106, 1979 (2006). doi: http://dx.doi.org/10.1021/cr050019q
- R. Karoui and C. Blecker, “Fluorescence spectroscopy measurement for quality assessment of food systems—a review”, Food Bioproc. Technol. 4, 364 (2010). doi: http://dx.doi.org/10.1007/s11947-010-0370-0
- Á. Andrade-Eiroa, G. de-Armas, J.-M. Estela and V. Cerdà, “Critical approach to synchronous spectrofluorimetry. I”, Trends Anal. Chem. 29, 885 (2010). doi: http://dx.doi.org/10.1016/j.trac.2010.04.010
- V. Uríčková and J. Sádecká, “Determination of geographical origin of alcoholic beverages using ultraviolet, visible and infrared spectroscopy: a review”, Spectrochim. Acta A 148, 131 (2015). doi: http://dx.doi.org/10.1016/j.saa.2015.03.111