A.M.C. Davies
Norwich Near Infrared Consultancy, 10 Aspen Way, Cringleford, Norwich NR4 6UA, UK. E-mail: [email protected]
Introduction
There are different definitions of the terms “classification” and “identity testing” in use, so I had better start by making my definitions! Not everyone will agree with them but you will know what I mean. Classification is the assignment of a sample to a group: beef meat, Australian honey, Robusta coffee. Identity testing is a confirmation (or otherwise) that an identifiable chemical is what it is claimed to be: sodium chloride, ethanol or 3,4-methylenedioxy-N-methylamphetamine (MDMA). I am sure you will agree that these two models are very different, but there has been quite a bit of confusion in the application of chemometric methods. I have been as guilty as others!
History
In my last column1 I told you that I started using MLR in 1966; this was true, but I was just using a program as advised by statisticians. My first venture into real pre-chemometrics was in 1969 when I was told to attempt to identify the country of origin of honeys from amino acid analysis (AAA) data. I had been investigating free amino acids in potatoes for about two years, so it was a natural extension. The reason for this work was that Gale’s honey (then part of J&J Colman, who employed me) were interested in demonstrating an alternative to pollen analysis. Some researchers were showing that computers might be useful for analysing large sets of data and this became my introduction into chemometric methods, not that it was then called by that name.
This topic of classification/identification is very interesting and has been one of my enduring topics over the last 45 years. Much of my published work on classification has concerned honey, so I will start with all that development before going into other areas.
Classification of honeys from free amino acid data
Free amino acids in honey (i.e. those not bound in proteins or peptides) are present in sufficient concentration for quantitative analysis by ion exchange chromatography. In 1969 this was still a fairly new technique and our apparatus allowed for four analyses per week (each chromatogram took 21 hours). It was soon obvious that this would be insufficient for honey classification, so the first task was to speed up the system, which was done by automating the sample input and the variation of the eluting buffers.2 This gave the potential of 14 analyses per week (but I cannot remember that we ever achieved that number). Not unexpectedly, this produced a problem of data overload! With four analyses per week the quantitation was made by manual measurement of peaks followed by calculation on an electronic calculator (also quite novel!). In order to analyse 14 chromatograms per week automation was required and achieved.2 (This experience of instrument and program development was very useful in later life!)
My reading of what I could find in the literature suggested that most people preferred to use ratios between variables rather than absolute amounts of variables, so I followed the ratio route. We found that there were 28 amino acids which were present in most of the honeys3 and these were used as the input variables for a characterisation program.4 If a variable was missing, it was given a value representing the limit of detection. The program computed all possible ratios but excluding reciprocals, giving 378 ratios, and then selected the 60 that were most consistent, as measured by their coefficient of variation. This was repeated for each honey from four geographical regions, using 10 samples from each area.
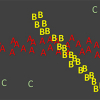
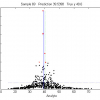
A second program4 was written to test honeys that came from the test or other regions and had not been used by the characterisation program. The test used was based on the Camp–Meidell inequality and was written for me by a Colman statistician, Andy Deans.a The method worked quite well in a limited test. Fifteen known samples were correctly assigned to their region and of 42 honeys, which did not come from any of the four test areas, only one was classified incorrectly as coming from one of the characterised areas.5 The use of ratios was also vindicated by the discovery of two ratios which gave a good separation of samples from the four areas, Figure 1.

In later work6,7 using canonical variates analysis (CVA) with AAA data we compared English and foreign honey6 samples and then four groups of European honeys7 using NIR spectroscopy rather than AAA. Both experiments gave promising results but were not considered sufficiently encouraging to provide funding for a large scale test!
Additional classification/ identification studies
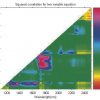
In 1982 I was very fortunate to attend the first International Diffuse Reflection Conference at Chambersburg, PA, USA where, amongst other, I met Professor Fred McClure. Fred introduced me and the conference to the application of Fourier Transformation (FT) as a processing tool for NIR data. One valuable attribute of FT is that it can be used to reduce the number of variables without loss of information. So instead of 700 wavelength variables we could work with 25 pairs of Fourier coefficients. This was important because I wanted to use a GENSTAT CVA program for discriminant analysis of instant coffee. I had been asked if NIR analysis could provide a rapid discrimination between regular and decaffeinated coffee. Figure 2 shows that it could.8 The wavelength data had to be reduced to 50 variables by averaging every 14 data points; it is obvious that FT is the better method of variable reduction.
 and Fourier domains. Reproduced with permission from Reference 8.")
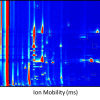
In 1990–1, I was the NIR supervisor for Hemant Pradhan’s MSc at the University of East Anglia (UEA). Our instrument at that time was a 14-filter Oxford QN1000. The original work on discriminant analysis by NIR was published by John Rose in 1982, using a 19-filter Technicon InfraAlyzer but subsequent work had always used scanning instruments. I decided we should experiment to see if a 14-filter instrument had discriminant powers. Hemant carried out three experiments looking at organic acids, the three isomers of chloro-benzoic acid and chloro- and bromo-benzoic acids. In all cases CVA was able to give a clear separation of the chemicals,9 as demonstrated by Figure 3.

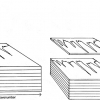
In 1993–4, I was the NIR supervisor for Michel Coene’s MSc at the UEA, when we had an NIRSystems 6500 scanning spectrometer available. He produced a set of sugars with different particle sizes and showed that when comparing spectra of the same sugar of different particle sizes with each other, quadratic regression gave a much better fit than the standard linear regression. He also found that when spectra of different chemicals were plotted against each other they produced interesting patterns. He named these “signature” plots.10
 sucrose, (b) fructose, (c) glucose, (d) galactose and (e) sorbose. Reproduced with permission from Reference 10.")
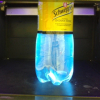
An interesting example is shown in Figure 4; an NIR spectrum of 2-chloro-benzoic acid was plotted against the spectra of five sugars. It is obvious that the sugars are very different to chloro-benzoic, but it is interesting to see the differences in the “signature” produced by the different sugars. When he first showed me these results I thought there must be some way of utilising them in identity testing but so far I have not found an answer!
In 1995, I worked for Foss Electric Development as a consultant during the development of the Foss Meatspec analyser. This was an NIR filter instrument calibrated to analyse pork or beef meats. It was decided that I should co-ordinate the design and testing of an identity check to test if the operator had selected the correct calibration. Contra to my normal recommendation, the selected system used PCA rather than CVA. Because of programming limitations for the instrument’s small on-board computer we tested the PCA approach first and found it gave acceptable results.11
Identity testing software
There are many methods for using NIR spectroscopy for quantitative analysis. Originally (in the 1970s) this was MLR which worked quite well with filter instruments where there were not very many variables. I began with a 19-filter instrument and then went to a scanning spectrometer that measured at 700 wavelengths. Harald Martens provided the partial least squares (PLS) option which was rapidly adopted by most commercial users and all instrument manufacturers provide the software. Some users prefer to use PLS software from a specialist provider so that all the calibrations, which may be for use in different makes of spectrometer, use the same PLS program. There have been quite a few developments aimed at replacing PLS but none have, so far, been widely accepted, PLS is difficult to supersede!
The situation is quite different with identity testing software. This became a competitive battleground among NIR instrument manufacturers, so there is an array of methods, most of them not based on well-tested statistical methods. While I believe this is undesirable there is another problem that I think should be a cause for concern. I explained this in a previous column in 2009.12 In pharmaceutical production all incoming raw materials must be subjected to an identification check (and again when a material is moved from one area to another). In the way that these identity programs work the identity testing analysis will be set up to discriminate all materials which will come into that site. However, the raw material supplier will have many materials that are not present on the manufacturing site. If the supplier incorrectly labels a material, there is no guarantee that this will be detected as an error when it arrives at the manufacturing site because it was not present when the method was set up. I organised a meeting under the aegis of the Royal Society of Chemistry Molecular Spectroscopy Group to discuss this perception but I was unable to persuade the assembled experts that there was a problem. Tom Fearn agrees that there is a potential problem but suggests that it is unlikely to occur. My experience is that many problems occur that no one had anticipated. My opinion is that if a potential problem has been identified then it is sensible to take measures to avoid it.
Is there going to be any development in methods or software?
I hope so! I think that the main problem is a confusion between classification and identification. NIR spectra are subject to variation due to particle size variation and moisture content (both in the sample and in the air inside the spectrometer) so if you measure a chemical from different sources you will see a variation in their spectra. This variation allows the application of methods that were originally developed for classification (such as CVA) because they form a cluster. What we should have been doing is to find ways of eliminating variation due to particle size and moisture and then using an appropriate test for identification. We now have an array of techniques for reducing interfering variation, but these have not been used to create a paradigm shift from the methods that are in current use. In classification you cannot be certain that every result is correct but it’s not too critical if an Australian honey is classified as Canadian. In identity testing you have to be confident that the answer is correct otherwise you may give some one MDMA instead of salt.
Tom Fearn and I have been developing a method for quantitative analysis (CARNAC)13 which I intend to discuss in my next column. I will mention it now because I have “half” an idea that some of the procedures in CARNAC could be combined with Michel Coene’s “signature” plot to provide a new method for identity testing. In CARNAC we search large databases for samples which are spectrally very similar to the spectrum of an un-analysed sample. In one trial of the method a single sample was found in a database of 7000 animal feeds whose spectrum was very similar to the spectrum of the test sample.
Conclusion
These are very much my personal views but I hope this will be seen as a challenge that should be responded to rather than ignored. The advantage of age is that it does not matter to me if I am wrong but it might matter to you!
References
- A.M.C. Davies, “The last furlong (4) Multi-Variable Regression”, Spectroscopy Europe 26(2), 23 (2014). http://bit.ly/1tSsdXj
- A.M.C. Davies, “Automation of a Technicon NC-1 amino acid analyser”, Lab. Practice 627, October (1973).
- A.M.C. Davies, “Amino acid analysis of honeys from eleven countries”, J. apic. Res. 14(3), 29 (1975).
- A.M.C. Davies, “The application of chromatographic data to commodity source identification”, J. Chromatogr. 115, 293 (1975). doi: http://dx.doi.org/10.1016/S0021-9673(01)98931-9
- A.M.C. Davies, “The application of amino acid analysis to the determination of the geographical origin of honey”, J. Fd Technol. 11, 515 (1976). doi: http://dx.doi.org/10.1111/j.1365-2621.1976.tb00752.x
- A.M.C. Davies and R.G. Harris, “Free amino acid analysis of honeys from England and Wales: application to the determination of the geographical origin of honeys”, J. apic. Res. 21(3), 168 (1982). http://bit.ly/X3Kkib
- A.M.C. Davies, B. Radovic, T. Fearn and E. Anklam, “A preliminary study on the characterisation of honey by near infrared spectroscopy”, J. Near Infrared Spectrosc. 10(2), 121 (2002). doi: http://dx.doi.org/10.1255/jnirs.329
- A.M.C. Davies and W.F. McClure, “Near infrared analysis in the Fourier domain with special reference to process control”, Anal. Proc. 22, 321 (1985). doi: http://dx.doi.org/10.1039/ap9852200321
- H. Pradhan, A.M.C. Davies and R. Grinter, “Can ‘simple’ instruments perform complex tasks?”, in Making Light Work: Advances in Near Infrared Spectroscopy, Ed by I. Murray and I.A. Cowe. VCH, Weinheim, p. 55 (1992).
- M.P.D. Coene, R. Grinter and A.M.C. Davies, “The use of quadratic regression in qualitative near infrared and visible spectroscopic analysis” J. Near Infrared Spectrosc. 4(1), 153 (1996). doi: http://dx.doi.10.1255/jnirs.86
- A.M.C. Davies, I.A. Cowe, R.P. Withey, C.G. Eddison and T. Fearn, “Commodity testing and sub-sample homogeneity system for the Meatspec analyser”, J. Near Infrared Spectrosc. 6, 69 (1998). doi: http://dx.doi.org/10.1255/jnirs.123
- A.M.C. Davies and T. Fearn, “Spectroscopic identification in the ‘real world’”, Spectroscopy Europe 21(2), 26 (2009). http://bit.ly/UwVJ8z
- A.M.C. Davies and T. Fearn, “Quantitative analysis via near infrared databases: Comparison analysis using restructured near infrared and constituent data—deux.(CARNAC—D)”, J. Near Infrared Spectrosc. 14, 403, (2006). doi: http://dx.doi.org/10.1255/jnirs.712