Antony N. Daviesa and Henk-Jan van Manenb,c
aSERC, Sustainable Environment Research Centre, Faculty of Computing, Engineering and Science, University of South Wales, UK
bExpert Capability Group – Measurement and Analytical Science, Nouryon Chemicals BV, Deventer, the Netherlands. https://www.nouryon.com/company/innovation/eccd/
cRadboud University, Institute for Molecules and Materials, Department of Analytical Chemistry & Chemometrics, Heyendaalseweg 135, 6525 AJ Nijmegen, The Netherlands
In traditional approaches to quantitative analysis we teach that the weight is mightier than the volume. You are far more accurate and precise when weighing chemicals to make up standard solutions than using volumetric techniques. There has been some debate about whether this approach carries over into process analytical spectroscopy and other areas of application, where often analyses are of liquid mixtures.
In fact, this column is also something of an apology to all my students who have suffered my sarcasm when they have ever tried to defend the use of volumetric methods over gravimetric to get the best calibration results! It is such a natural reaction that to come up with another view on the world during discussions with Henk-Jan van Manen has been quite refreshing if, looking at my own behaviour, a little worrying.
We are spectroscopists so we all live by Beer’s Law—right?
Henk-Jan pointed to an article written by Howard Mark and a number of his colleagues in Applied Spectroscopy back in 2010.1 This paper looked into problems and discrepancies arising using standard gravimetric methods and weight fractions in calibrations for spectroscopic quantitative analysis. Howard Mark has been a prolific writer in the USA over the years, both in the peer reviewed literature and in generating a long series of general interest educational articles with a strong focus on chemometrics in a similar vein to our own former column editor Tony (A.M.C.) Davies.
For normal quantitative work we all live by Beer’s law. Essentially, for each component in our sample, for example in a standard sample cell, there is a linear relationship between their contribution to the overall absorbance signal measured, the specific absorptivity of each component, the concentration of that component and the total pathlength light must travel through the sample. Assuming no changing interactions between the components at different relative concentrations, the pathlength is a constant and a straight-line calibration graph should be obtained for each component, the slope of which depends on how absorbing each individual component is. For the more detailed official IUPAC definition, see Reference 3. Essentially, this underlying linear relationship between concentration and signal is the bedrock of the majority of quantitative spectroscopy. It is normal practice to accept that Beer’s law holds true for only dilute systems and that at high analyte concentrations non-linear effects start to adversely affect quantitative analysis studies.
Weight fractions or volume fractions—that is the question?
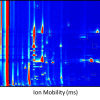
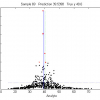
So what Howard Mark observed in his original paper was the lack of clear understanding of the impact that selecting a particular way of expressing “concentration” might have on the use of chemometric models, particularly when applied to mixtures of liquids, which are commonly found in industrial applications of vibrational spectroscopy. The most widely used weight % concentration unit in analytical spectroscopy was challenged in his paper in a logical way. He showed the linear relationship between volume % and concentration using near infrared (NIR) spectroscopy and drawing on the observation that for pure liquids there is not a clear linear relationship between weight % and volume % for liquids of different densities (he originally reported data for binary and ternary mixtures of toluene, dichloromethane and n-heptane). Figure 1 shows spectroscopic experimental results from the Deventer team using CLS on 21 binary mixture spectra as done by Howard Mark. This emphasised the potential deviation from the accepted Beer’s law linear relationship between “concentration” and signal intensity if mass or volume fractions are used.
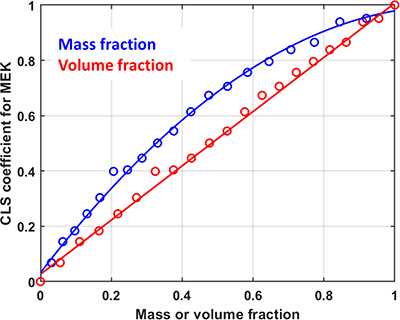
Figure 1. Comparison between the NIR spectroscopic signal of a binary mixture of chloroform/MEK (methyl ethyl ketone).
Kim Esbensen, Paul Geladi and Anders Larsen followed up in 2012 with a nice short article in NIR news in their “Mythbusters in Chemometrics” column which reinforced Howard’s observations.4 They studied data provided to them on 70 mixtures of five components (butanol, dichloromethane, methanol, dichloropropane and acetone). Their article includes two figures (Figure 2 for butanol and Figure 3 for methanol), which were quite startling to my eyes as they showed an effect I have seen regularly in chemometric calibrations, but which I had put down to, maybe wrongly, inaccuracies in the reference method concentration determinations.
In 2017, Howard published another article on this topic in NIR news directly looking at the effect of the selection of the measurement units on NIR calibrations.5 In this article he focussed more on common effects observed in NIR chemometric models and how the impact of selecting mass fraction rather than volume can impact the quality of the results. The difference between using Classical Least Squares (CLS) algorithms and Partial Least Squares (PLS) and other models is highlighted (see below).
However, to muddy the waters a little, a paper was published recently by Yan and co-workers which reported that they had been unable to confirm the benefit of using volume % over weight % concentration units in their studies of benzene/cyclohexane/ethylbenzene and ethyl acetate/heptan-1-ol/1,4-dioxane ternary mixtures.6 Although they were looking primarily for the effect of hydrogen bonding on the performance of CLS and PLS algorithms.
Have sympathy on the overworked chemometric algorithms!
Howard selected CLS for his study, partly because it is the easiest chemometric model to explain, consisting essentially of linear combinations of pure component spectra to make up the overall observed spectrum. The drawback is that you are assuming no interactions between the components in the mixture, such as were studied by Yan and co-workers. Howard and others have remarked that the inability of CLS models to cope with other types of interactions is one of the reasons PLS and other models tend to be favoured (including by the authors of this column, as I have mentioned in previous articles). PLS modelling can often be accused of overfitting, as more factors are used to create the model than you would think are really necessary—and one conclusion could well be that the PLS algorithm (essential a model expecting a linear relationship between concentration and signal) is having to work overtime to cope with the fact that the concentration data it is being fed is not actually strictly linear. The model, therefore, is often generated with additional factors to try to compensate for this non-linearity.
So how bad can it get? Well, the papers cited claim that the non-linearity can cause errors in the calibrations of up to 10–15 %. So, this is one of the reasons that Henk-Jan and his team from Nouryon and the Radboud University in Nijmegen decided to get a definitive answer to the question of weight against volume, as 10–15 % wrong in an industrial control process could be worth a lot of money!
Robotics for more reproducible calibration samples
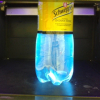
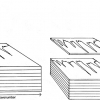
One of the aspects of ensuring good quality analytical measurements is acknowledging and minimising errors from sources that might obscure the changes in the data you are analysing. The Royal Society of Chemistry Analytical Methods Committee of the Analytical Division produce good Technical Briefs to help analytical chemists and they identify human error as the greatest source of problems during chemical analysis.7 Henk-Jan’s team required the best possible accuracy and precision in their production and measurement of the various binary solvent mixtures they were investigating. As human error in weighing and mixing samples both by individuals and between different experimenters can introduce noise, it was decided to exploit a suite of robots available for use in projects at the Expert Capability Center Deventer.8 They used a high-throughput liquid handling robot from Syntegon Technology GmbH (formerly known as Bosch Packaging Technology) to prepare their binary liquid systems with 30 samples being prepared across the full mass or volume fraction range from 0 to 1 (Figure 2). They also have access to a repurposed high-throughput Lipos robotic platform (Zinsser Analytic GmbH, Frankfurt, Germany) which was set up to allow automated spectroscopic determinations of the samples (Figure 3). This robot was equipped with online NIR measurements performed on a Bruker MPA instrument (Bruker Optics, Ettlingen, Germany), Raman measurements using a Kaiser RXN-4 instrument (Kaiser Optical Systems, Ann Arbor, MI) by using a fibre-optic probe and further supported by mid-infrared spectroscopic measurements using a Spectrum 100 instrument (PerkinElmer, Groningen, The Netherlands) in attenuated total reflection mode using a diamond crystal (Figure 3).
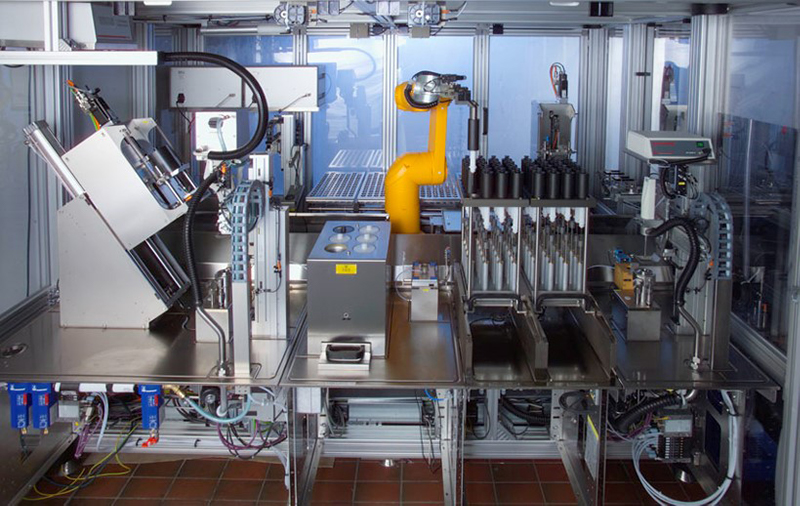
Figure 2. High-throughput liquid handling robot from Syntegon Technology GmbH used for reference liquid sample preparation to reduce error in the reference mixture preparation.
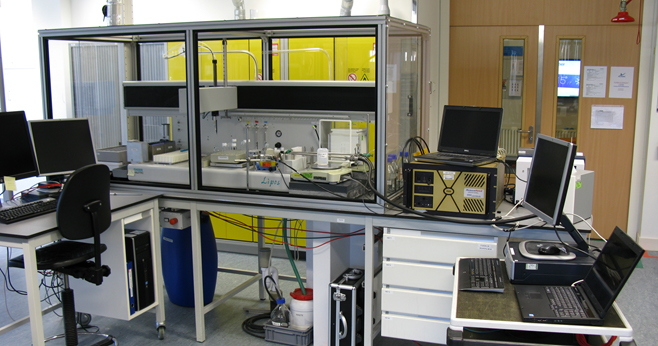
Figure 3. Zinsser robot at the Expert Capability Center in Deventer with integrated automatic spectroscopic analysis of the liquid samples created by the other high-throughput liquid handling robot.
Henk-Jan and the team deliberately selected binary systems of pure liquids, avoiding materials that might suffer from strong inter-component interactions when mixed. They chose chloroform/heptane, chloroform/toluene, toluene/heptane and methylethylketone (MEK)/heptane. And, unfortunately, that is all we are going to say about their study to confirm Howard Mark’s original observations for now… you will have to wait until the full paper is published to get at all the juicy details!
Conclusions
What these various pieces of work over the last 10 years show, apart from the fact that I need to be kinder to my students, is that we need to always bear in mind whether handed-down wisdom should be accepted as-is or be challenged when we start to see effects that we cannot easily explain.
I have always hated being reliant on “black-box” approaches to achieving analytical results, which used to be propagated by some chemometricians. I often annoy colleagues by persistently asking “but why?” like a petulant child when getting answers such as “we don’t know”, “we just ignore that”, “just trust the algorithm”. Howard Mark’s work and the subsequent studies have at least provided some answers to effects we see in everyday experiments which are unexpected.
Henk-Jan’s teams’ confirmatory experiments and results will be published elsewhere in full, when we have the link, we will add it to the online version of this column. Everyone please, stay safe!
Acknowledgements
HJM would like to thank Nouryon colleagues Jan Gerretzen, Martijn Smout, Ali Ghamati and René van Egdom and Radboud colleagues Geert Postma and Jeroen Jansen.
References
- H. Mark, R. Rubinovitz, D. Heaps, P. Gemperline and D. Dahm, “Comparison of the use of volume fractions with other measures of concentration for quantitative spectroscopic calibration using the classical least squares method”, Appl Spectrosc. 64(9), 995–1006 (2010). https://doi.org/10.1366/000370210792434314
- https://eas.org/2020/
- https://goldbook.iupac.org/terms/view/B00626
- K.H. Esbensen, P. Geladi and A. Larsen, “‘Concentration’ is a fixed, immutable property”, NIR news 23(5), 16–18 (2012). https://doi.org/10.1255/nirn.1317
- H. Mark, “Effect of measurement units on NIR calibrations”, NIR news 28(3), 7–11 (2017). https://doi.org/10.1177/0960336017703255
- H. Yan, Y. Ma, Z. Xiong, H.W. Siesler, L. Qi and G. Zhang, “Quantitative analysis of organic liquid three-component systems: near-infrared transmission versus Raman spectroscopy, partial least squares versus classical least squares regression evaluation and volume versus weight percent concentration units”, Molecules 24(19), 3564 (2019). https://doi.org/10.3390/molecules24193564
- Analytical Methods Committee, AMCTB No 56, “What causes most errors in chemical analysis?”, Anal. Meth. 5, 2914–2915 (2013). https://doi.org/10.1039/C3AY90035E
- https://www.nouryon.com/company/innovation/eccd/