Todd Strother
Thermo Fisher Scientific, Madison, WI, USA
Introduction
Biologically produced materials are an increasingly important aspect in many industrial processes including those related to pharmaceuticals, food, diagnostics and fuels. Most of these biologicals are produced in fermentors and bioreactors in which specialised cell cultures grow and form the molecule of interest. Many different types of cells are used in culturing and producing biopharmaceutical products including genetically engineered bacterial and yeast cells. However, a majority of the products are proteins cultured from mammalian systems such as Chinese hamster ovary (CHO), green monkey (VERO) or human embryonic kidney (HEK) cell lines. Many of these products are large complex proteins, hormones or polysaccharides that are impossible or difficult to manufacture in large quantities in any other way. A recent survey of the USA Food and Drug Administration noted that more than 350 biologicals are approved for various uses including vaccines and diagnostic and therapeutically important antibodies.
Protein concentration is a critical parameter in determining the success and quality of a cell culture in manufacturing a viable end product. This article evaluates the capability of a Fourier transform near infrared (FT-NIR) spectroscopy process analyser to predict biologically relevant protein concentrations in dynamic cell cultures. Protein concentrations were analysed using CHO cell cultures. The cell culture samples were scanned with the process analyser coupled to a transflection probe. Chemometric analysis of the sample spectra was then undertaken using a partial least squares (PLS) method. The experimental results demonstrated that PLS analysis of the protein concentrations in various cell culture samples offered excellent predictive capabilities within the range of materials tested, with actual protein concentrations between 0.16 g L–1 and 5.0 g L–1, with errors of less than 0.5 g L–1. This feasibility study revealed that an FT-NIR analyser can correctly predict target protein concentrations in a live and dynamic cell culture.
Bioprocess challenges
By their nature, bioprocesses that produce the desired materials rely on complex biological systems to synthesise their useful products. While typical chemical manufacturing processes have relatively little variability, the inherent complexity of biological systems makes a great deal of variability from batch to batch inevitable. As a consequence of the complexity and variability of the processes, it has been estimated that 30% of the production batches need to be reprocessed for quality reasons, which results in a 10-fold loss in profit. The key for bioprocess manufacturers in trying to make a consistent product is limiting variability. This requires close control of the bioreactor operation, which in turn requires information about the process occurring in the bioreactor through analysis and tracking.
Industries that rely on complex biological systems benefit greatly from closely monitoring the growth of their cell cultures and production of the target molecule. By monitoring and controlling cell culture conditions, bioprocess manufacturers have an opportunity to analyse batches faster and more often, resulting in improved target protein production. Monitoring protein production is a key method of determining if the cell culture is functioning properly and the end result will be the expected product. However, proteins are difficult to analyse in bioreactors mainly because the concentrations are generally low. It can also be challenging to distinguish between the target protein and any other proteins that the cells are producing. Since the target protein needs to go through certain modification steps, it is important to definitively identify that the proteins being produced are the ones that are intended for the final product.
Manual methods of monitoring bioprocesses require that technicians disturb the process by removing samples and analysing them in a separate laboratory. These manual methods require significant amounts of time and dedicated resources in order to complete the analyses. The nature of biological production processes demands both high throughput and economically viable technologies. As such, manufacturers of biological products are constantly looking for improved measurement techniques that can be successfully implemented at the production level. Process Analytical Technology (PAT) initiatives in bioprocesses improve the overall product quality and reduce waste by decreasing and accounting for this inherent variability of the process.1 Analysis and quality control by NIR spectroscopy is a key part of these initiatives.
The power of NIR spectroscopy
NIR spectroscopy has proven to be a simple and reliable technology for quality control and dynamic measurement of manufacturing processes, including bioprocess applications.2 The key benefits of NIR spectroscopy include the ease of spectral sampling and the speed in obtaining analytical results, both of which provide better control of the process. For example, an FT-NIR process analyser has the capability to take an online sample every 10 s, as opposed to other techniques, which typically process one sample per day. This powerful technology offers great potential for significant time and cost savings associated with increasing yield and lowering the number of failed or reworked batches.
NIR spectroscopy utilises light between 12,820 cm–1 and 4000 cm–1 (780–2500 nm) to determine the identity and quantity of a variety of materials. Most organic molecules of interest absorb light in this region through combination or overtone vibrations. The advantage of performing spectral analysis on these absorption bands is that the light is able to penetrate more deeply into the material under analysis and does not require dilution or manipulation of the sample. Therefore, NIR analysers can be coupled directly into a process stream or tank where spectral analysis can be performed without human intervention;3 NIR spectroscopy allows for automatic analysis and real time results without the need to withdraw samples.
Previous work performed on cell cultures using NIR spectroscopy has usually focused on monitoring and controlling nutrients, waste products, cell densities and other parameters related to the health of the cell culture.4,5,6 While these parameters are useful for determining the relative health of the cell culture, the more important parameter of interest is the actual production and concentration of the target molecule. Very few NIR spectroscopic studies have determined and measured protein concentrations in actual cell culture conditions. Advances in multivariate chemometric algorithms along with improvements in instrumentation have opened up the possibility to extend the capability of NIR spectroscopy to predict protein concentration in cell cultures. In this article, the feasibility of using an FT-NIR process analyser to predict protein concentrations at biologically relevant concentrations in dynamic cell cultures is demonstrated.
Methods
CHO cell cultures were grown at optimal conditions until the cell concentrations reached approximately one million per millilitre. This represents a typical cell density for a young and growing culture. Samples of the cell culture were tested on a Nova BioProfile® analyser (Nova Biomedical, Waltham, MA, USA) to determine concentrations of glucose, glutamine, lactate and ammonia. The concentrations of these materials changed throughout the experiment and accounted for some variability that might be encountered across multiple cultures. The concentrations were variously and singularly altered by spiking the samples with nutrients or waste products or diluting the samples with unaltered cell culture. Each of those four components was altered so that two or three different concentrations were represented for each. Table 1 lists the concentration ranges for the various nutrient, waste and protein components of the tested samples. This methodology also has the effect of removing covariance between the different components and protein present. Ultrapure bovine albumin protein was added to the solutions to represent the target protein synthesised by the cells.
Table 1. Concentration ranges of various components. The solutions represented over 35 different protein concentrations that also varied in concentrations of nutrient and waste components.
Component | Range (g L–1) |
Protein | 0.16–5.23 |
Glucose | 7.98–8.12 |
Glutamine | 0.28–0.58 |
Lactate | 0.45–0.90 |
Ammonia | 0.05–2.39 |
Genetically modified cell cultures are designed to produce the target protein in large quantities almost exclusively to all other cellular proteins. As a result, the protein concentrations in the cell culture media will often approach and exceed 5.0 g L–1 and consist almost entirely of the target molecule. Albumin protein is an excellent mimic for recombinant proteins because it is available in extremely pure form and contains NIR spectroscopic active groups essentially identical to a typical target protein from a cell culture. In this case, purity is extremely important because any extraneous material present will also have an NIR signal and would lead to confounding results. The albumin protein material was carefully weighed and added to the cell cultures in concentrations ranging from 0.16 g L–1 to 5.0 g L–1. Over 35 different solutions were produced that had a range of nutrient and waste as well as protein concentrations. These varied solutions resulted in 54 spectra that were used to build the chemometric method and 20 spectra that were used to validate that method.
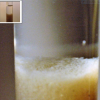
The cell culture samples were scanned with a Thermo Scientific Antaris MX process analyser (Thermo Fisher Scientific, Madison, WI, USA) in the range between 10,000 cm–1 and 4000 cm–1. The analyser was coupled to a transflection probe with an adjustable pathlength. The gap distance was set to 1.25 mm for a total pathlength of 2.5 mm. Sixteen scans were averaged per spectrum and were collected using 8 cm–1 resolution. Sample time took approximately 15 s. Two spectra were collected per sample. Figure 1 shows images of the probe before insertion into a cell culture sample and during spectral collection. The sample spectra were loaded into Thermo Scientific TQ Analyst software (Thermo Fisher Scientific) for chemometric analysis using a PLS method with a constant pathlength. The spectra were analysed in the first derivative mode using a Norris smoothing filter. Two regions were used for the analysis: 8910–5340 cm–1 and 4830–4340 cm–1. These two regions collected information across a wide range of data points while avoiding the totally attenuating water peak centred around 5100 cm–1. Figure 2 shows representative raw spectra and the first derivative spectra of the samples.


Results
Partial least squares analysis of the protein concentrations in the various cell culture samples revealed excellent predictive capabilities within the range of materials tested. The 54 spectra used to develop the PLS method are shown on a calibration plot (Figure 3) that compares the calculated protein concentrations versus the actual concentrations. The calibration plot can be used to determine how well the method predicts the actual protein concentrations in the samples. The plot developed by the chemometric method resulted in a correlation coefficient of 0.977. Root Mean Square Error of Calibration (RMSEC) was 0.33 g L–1 and the Root Mean Square Error of Prediction (RMSEP) calculated from the 20 validation samples was 0.31 g L–1. Additionally, the Root Mean Square Error of Cross Validation (RMSECV) was 0.51 g L–1. These errors indicate that the protein concentration in the cell culture samples can be predicted to 0.5 g L–1 or less. Approximately 1⁄3 of this error was attributed to the balance used to weigh the protein material.
 are spectra used to validate the method. [The red circle is a screen capture software artifact; it is a blue circle type.]")
Conclusions
This feasibility study shows an FT-NIR spectroscopic analyser can correctly predict target protein concentrations in a live and dynamic cell culture. This technique successfully demonstrates the capability to measure and monitor protein concentrations in real time at relevant concentrations. The method developed shows excellent correlation with actual protein concentrations between 0.16 g L–1 and 5.0 g L–1, with errors of less than 0.5 g L–1. This application demonstrates the continued capability of an FT-NIR spectroscopic system to be successfully used in bioprocess environments where it can safely, accurately and automatically monitor, control and predict target protein concentrations in cell cultures.
Because NIR spectroscopy is a real time and automatic non-invasive technique for analysing biological materials, the potential use with bioreactors holds great promise for biopharmaceutical companies. NIR spectroscopy provides long-term calibration stability along with versatility, making it relatively easy to implement in a production environment. Real-time process control of biologicals is desirable to the bioprocess manufacturing world, and NIR spectroscopy is a fast, non-destructive technique that is suitable in this context. Achieving optimal production conditions requires measuring the factors that influence the performance of a bioprocess. For process control applications, this would preferably occur online and in real-time so that appropriate control or remedial action can be taken. NIR spectroscopy has the potential to be used routinely to fill this need in the bioprocess manufacturing industry by improving the industry’s capabilities for quality control procedures. Previous studies have already shown that NIR spectroscopy can monitor cell culture conditions to promote optimal protein production. Now this technique can be extended to both monitor and predict protein concentrations.
NIR spectroscopy offers the potential for bioprocess manufacturing companies to limit the variability in the biological production process, thereby increasing the yield and reducing the number of errors. Therefore, manufacturers can reduce the time and costs associated with reworking batches or determining batch failures. NIR spectroscopy also provides advantages in the ease of data extraction as well as the speed in obtaining analysis results, both of which provide better control of the process. This eliminates the need for manual methods of monitoring bioprocesses that required technicians to let the bioreactor continue through the expected timeline and then test for quality assurance, or disturb the process by pulling out samples and analysing them in a separate laboratory. Reducing the need for manual analysis methods also reduces the time and costs associated with quality control procedures. Adding the capability to predict protein concentration as a PAT initiative holds great potential for bioprocess manufacturers to improve the success rate and quality of cell cultures in developing a viable end product.
References
- T. Becker, B. Hitzmann, K. Muffler, R. Pörtner, K.F. Reardon, F. Stahl and R. Ulber, “Future aspects of bioprocess monitoring”, Biochem. Eng. Biotechnol. 105, 249–293 (2007).https://doi.org/10.1007/10_2006_036
- R.A. Naughton, T.R. Rohrer and R.L. Gentz, “Method and system for providing real-time, in situ biomanufacturing process monitoring and control in response to IR spectroscopy”, Patent US 2002/0155541 Al, October 24, 2002.
- S. Vaidyanathan, G. Macaloney, J. Vaughan, B. McNeil and L.M. Harvey, “Monitoring of submerged bioprocesses”, Crit. Rev. Biotechnol. 19(4), 277–316 (1999).https://doi.org/10.1080/0738-859991229161
- J. Crowley, S.A. Arnold, N. Wood, L.M. Harvey and B. McNeil, “Monitoring a high cell density recombinant Pichia pastoris fed-batch bioprocess using transmission and reflectance near infrared spectroscopy”, Enzyme Microb. Tech. 36, 621–628 (2005).https://doi.org/10.1016/j.enzmictec.2003.12.016
- S. Harthun, K. Matischak and P. Friedl, “Determination of recombinant protein in animal cell culture supernatant by near-infrared spectroscopy”, Anal. Biochem. 251, 73–78 (1997).https://doi.org/10.1006/abio.1997.2218
- S. Vaidyanathan, L.M. Harvey and B. McNeil, “Deconvolution of near-infrared spectral information for monitoring mycelial biomass and other key analytes in a submerged fungal bioprocess”, Anal. Chim. Acta 428, 41–59 (2001).https://doi.org/10.1016/S0003-2670(00)01205-8